After a long process, the voting primary states have nearly ended. California is not only the biggest prize in the calendar on June 7th, it is also the largest with 475 pledged delegates. Senator Sanders is hoping a win here will weaken Secretary Clinton’s argument for the nomination while Secretary Clinton is hoping for not only a win but a decisive win that will show she is still widely popular among the Democratic base (as head to head polls currently show) and that she is the clear choice of the Democratic Party.
California has demographics that strongly favor Secretary Clinton. Despite the strong population of young people with California’s many colleges and universities and the strong progressive streak, Secretary Clinton has the strong advantage here. One poll showed Secretary Clinton ahead by only 2 points but it was taken over the span of nine days (generally too long for a poll) with a small sample size compared to another poll (Survey USA) showing her ahead by 18 points. At the same time, polling Latino voters in California has been historically difficult so it remains to be seen who Latino voters will decide to support.
Arizona and Oregon also help predict California’s results as well. Arizona has a large Latino population, mainly Mexican while California’s Latino population is extremely diverse but majority Mexican as well. This leads me to believe Secretary Clinton will win the support of the majority of the California Latinos. Oregon has a smaller percentage of Latinos (10%) but has a large population of progressive white voters in Portland and its surrounding area.
To predict Secretary Clinton’s win in California, I looked at the 2008 map where she won California by 8 points. I predict a roughly 10 point win here in 2016. Secretary Clinton will gain votes with upscale Democrats (West Coast) and with African American and lose votes with rural white voters (the Sierras) and potentially a few points with Latino voters.
This is my prediction for the 2016 Democratic primary.
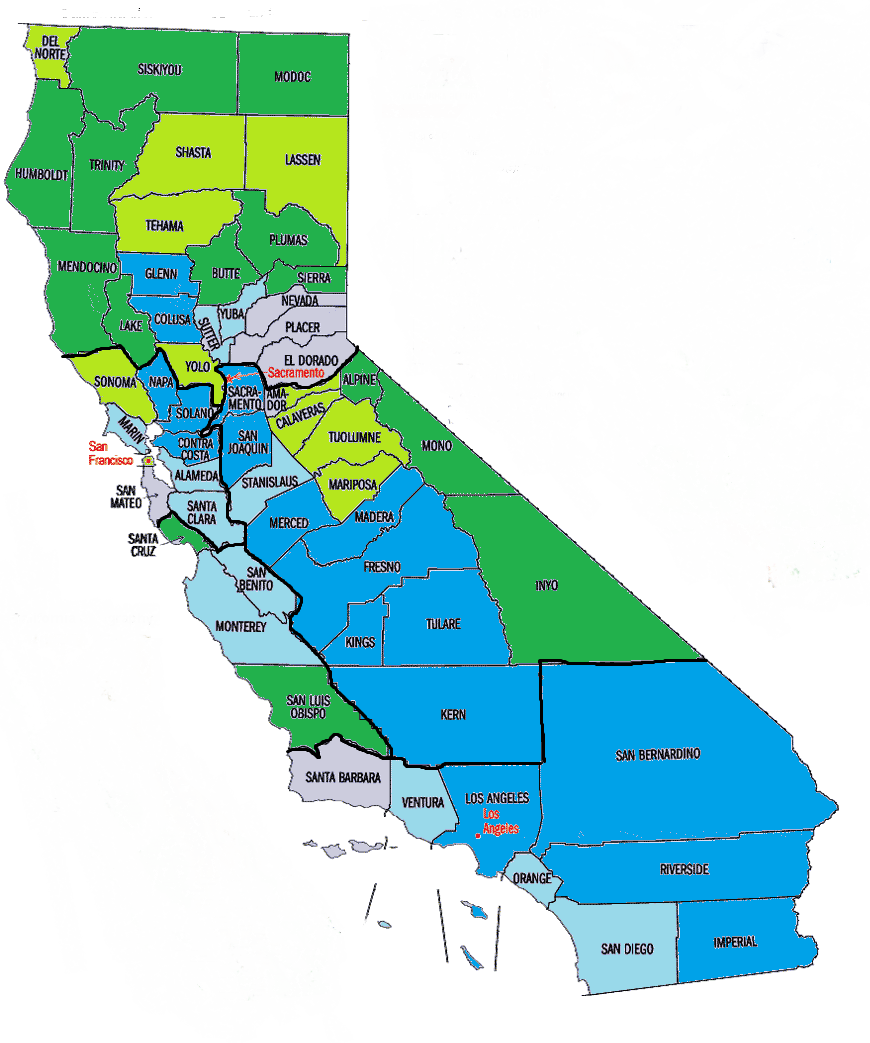
Dark Blue = Solid Clinton
Light Blue = Lean Clinton
Grey = Tossup
Light Green = Lean Sanders
Solid Green = Solid Sanders
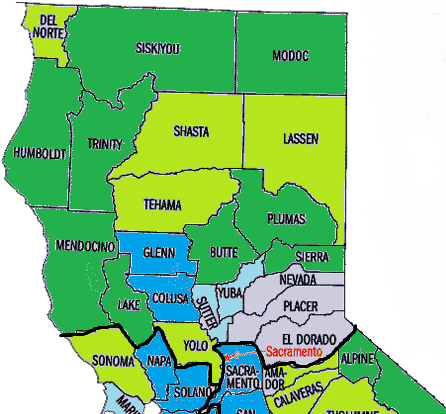
2008 Primary Results as Comparison:

Northern California:
Humboldt County:
This county is a quintessential Bernie County. Not only is it heavily white (78%) and rural, it also has a large number of progressives (they are not as upscale as the Marin County progressives) and has Humboldt State University. I expect Sanders to break +20 here.
Mendocino County:
Mendocino County should vote for Senator Sanders as well but it is less favorable to him than Humboldt County. The reason is that due to the large number of wealthy Bay Area transplants here and the growing influence of the wine country (I expect Napa County which has a large number of Latinos and upscale Democrats to support Secretary Clinton) Secretary Clinton will have a base here. What will allow Senator Sanders to carry Mendocino though is the rural working class voters inland in Ukiah and Wilitis. He will also be helped by longtime residents here as well as baby boomers who settled here in the 1970s. Overall I predict a Sanders +10 here.
Border Counties:
The counties of Del Norte, Siskiyou and Modoc are all heavily white, rural and have large elderly populations (over 20% in many of them). This will allow Secretary Clinton to not face a blowout here (similarly to Oregon’s southern counties) but should not be enough for her to win any of them.
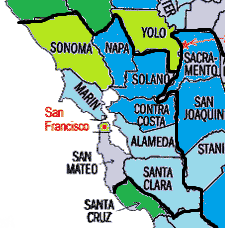
Bay Area:
Alameda County:
This county will narrowly lean Clinton. On one hand, it has heavily African American areas (12% countywide) in Oakland and wealthier areas (Dublin) that will vote strongly for Secretary Clinton. Alameda County also has a 23% Latino and 29% Asian population. At the same time, Alameda County is also home to Berkeley which is probably one of the strongest Bernie cities in the state. It is home to extremely progressive and young Democrats (and I saw Jill Stein at an event there). The southern part of the county is more Latino which should favor Secretary Clinton but Berkeley has high Democratic turnout and the hipsters in Oakland may offset the African American voters there supporting Secretary Clinton. Overall I predict Secretary Clinton +4 due to the southern part of Alameda County saving Secretary Clinton.
Contra Costa County:
If any county in the Bay Area were made for Hillary, it would be this one. Not only does Contra Costa have a 10% African American population (it is home to heavily African American city of Richmond), it also has very upscale suburbs similar to the Philadelphia suburbs and the Upper East Side that Hillary won. There are a few working class areas (Martinez) but they should be outvoted by the wealthier areas (Lafayette, Walnut Creek, Danville). I predict a +17 Secretary Clinton win here.
Marin County:
As a resident of Marin County, I am so excited to finally discuss how my county will vote. At a first glance, Marin County appears to be strongly for Bernie. It is 72% White and very progressive (it was the strongest Obama primary county in California in 2008, backing him by 19 points). Environmentalism is the key issue here, we love hiking in the redwoods on Mt. Tam, we love our salmon, we love protecting our unspoiled coastline and we love our four Whole Foods markets. One town, Fairfax is a proud town with many former hippies very proud of its heritage (and West Marin is very similar with many rural progressives). On the other hand, there are some very wealthy areas in Marin County (Tiburon, Ross) which are still Democratic but many of the Dems there are more moderate and similar to upscale Democrats Secretary Clinton won on the East Coast. The average age is also 44 years old. The bellwether here is Mill Valley which is home to many progressives and many upscale Democrats (there are two Whole Foods within a mile of each other). At the same time, Marin County may appear very pro Secretary Clinton on a data model due to demographics similar to Montgomery County, PA, Montgomery County, MD and Westchester County which overwhelmingly backed Hillary, I expect Marin County to be very close due to the strong progressivism and activism many of the Democrats here have. While I expect the West Marin/Fairfax contingent to post a strong showing for Bernie, Marin will support Hillary thanks to supporters in the southern part of the county. I predict Clinton +4 here.
San Mateo County:
The key to determining how San Mateo County votes is by looking at the divide between the areas along the Bay which are full of young tech workers. The upper parts of the county though are more older (Hillsborough, Woodside) and more wealthy which would imply a win for Secretary Clinton. San Mateo County is currently labeled as “too close to call” thanks to the large numbers of tech workers here (and Senator Sanders is also helped by the working class residents of South San Francisco). Secretary Clinton also won here in 2008 by six points despite losses among the young tech workers (although provided there are more now than in 2008). Overall, I give this county Clinton +1 but with the potential closeness it is marked as “too close to call” on the map.
Santa Clara County:
At a first glance, Santa Clara County may appear to be a swing county due to the large number of young people working in Silicon Valley. Once one leaves the valley however and heads to the mountains, the demographics change and become more upscale (Campbell, Saratoga, Mountain View etc), which favors Secretary Clinton. As shown in Oregon, Sanders won wealthy suburban areas in Portland (Clackamas County) by three points (I am using it to compare upscale Democrats on the West Coast) but Clackamas County is not as wealthy as parts of Santa Clara County and it does not have the minority population Santa Clara has. Also, Santa Clara County has a significant Latino population (26%) which is the largest in the Bay Area. The Asian population here is 35% and while there is little data on how Asian Democrats vote in the primary (especially Vietnamese due to the large Vietnamese population here), the best data we have is the NY primary results where Secretary Clinton won 60%-65% in heavily Asian neighborhoods. While Santa Clara County and San Mateo County are similar demographically in some ways, what gives Secretary Clinton a higher percentage here than in San Mateo is the higher Latino population. Also, Secretary Clinton won by 13 points here in 2008 despite President Obama winning among the young tech workers. In terms of polls, the best data here is a Clinton +13 poll here which is a bit out of line with our Secretary Clinton +5 win here.
San Francisco County:
While demographics of many California counties may appear obscure, what is not obscure is the San Francisco demographics. With a large population of progressive voters and young voters, San Francisco is prime territory for Senator Sanders. At the same time here, he will not win a blowout here that he will need to counterbalance Secretary Clinton’s wins in SoCal. The reason is that many of the wealthy voters in the Pacific Heights will favor Secretary Clinton. The Asian voters in the Sunset District will probably favor Secretary Clinton (but as shown by heavily Asian areas in NY, probably not by large margins). Overall, I predict a +7 Sanders win here, thanks to margins from young voters and from progressives.
Central Coast:
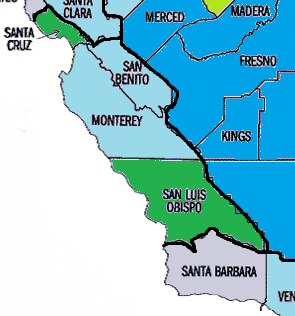
This region contains Santa Cruz, Monterey and San Luis Obispo Counties.
Santa Cruz County:
Santa Cruz county is similar demographically to Marin County. There are many environmental progressive voters here as well as UC Santa Cruz and Watsonville which is heavily Latino (Santa Cruz County is 30% Latino). While Watsonville should lean Secretary Clinton, it should be outvoted by the rest of Santa Cruz County which I expect to heavily back Bernie. I expect Sanders +7 here.
Monterey County:
Monterey County similarly to 2008 will mostly likely go for Hillary. Not only is it 57% Latino, it also has a large upscale white voter population. At the same time, it is important to note that due to the low turnout rates of Latinos, a 57% Latino population does not guarantee a Latino majority in voting, even in a Democratic primary (in a general election a 65% Latino area may have a majority Latino vote) due to the age of many of the voters. While many of these voters are strong environmentalists similarly to Santa Cruz and Marin Counties, many of these voters are very upscale and may not be progressive activists the way voters in Marin and Santa Cruz Counties are. I expect Secretary Clinton to win here by roughly 10%.
San Luis Obispo County:
With Cal Poly, a smaller Latino percentage than nearby counties (and the smallest percentage in a coastal county south of the Bay Area) and a large number of rural progressives, San Luis Obispo County should vote strongly for Senator Sanders. I predict Sanders +10 here.
Central Valley:
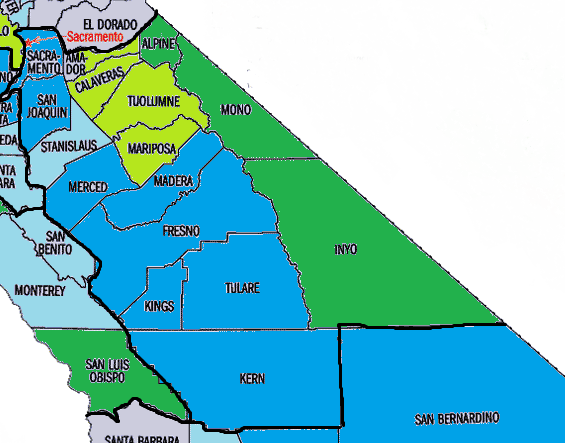
Sacramento County:
Sacramento County will probably vote for Secretary Clinton but not by a large margin. The reason is that there is a large young population here in Downtown Sacramento. At the same time, this is the state capitol with political people who would be more likely to support Secretary Clinton. Not to mention the African American population here is 11% and the Latino population is 23%. Compared to Marion County in Oregon with Oregon’s state capital which narrowly backed Bernie and had a similar Latino population, Sacramento County should back Secretary Clinton by roughly 12% thanks to the additions of the African American and Asian populations.
Stanislaus County:
If there is one farming county Senator Sanders wins, it will be this one. As shown in the 2012 election results, President Obama won here despite Stanislaus County having a 44% Latino population here (counties in the southern Central Valley with Latino populations in the 50s voted for Romney). This shows that there is a contingent of white Democrats here that may be much smaller in southern Central Valley counties. Also, many of the white Democrats here are working class, giving Senator Sanders an opening. I still expect a Secretary Clinton win but it could be close.
Merced County:
Despite the 58% Latino population here, this is a county where Senator Sanders may make a close race. The reason is that UC Merced is here and Senator Sanders performs very well with college students. I predict a +10 win for Secretary Clinton with the large Latino population carrying her to victory.
Kern County:
This county is heavily Latino with a large young population as well (30% of the population is under 18). At the same time, many of the Latinos here are involved in the farmworking industry which favors Secretary Clinton due to the strong support she received there. Also, the white population here is strongly Republican, preventing Senator Sanders from narrowing the margin here with white working class voters. I predict a +20 Secretary Clinton win here.
Southern California:

Santa Barbara County:
In California elections, Santa Barbara County is a bellwether. It is a good representation of the state. It has a liberal university, it has wealthy liberal voters, it has heavily Latino communities in an urban area (East Santa Barbara), it has heavily Latino communities in an agricultural area (Lompoc, Santa Maria), it has upscale Republicans (Montecito), and rural Republicans (Santa Ynez). Therefore, I expect Santa Barbara to represent the state of California and have the Latinos and the wealthy voters carry Secretary Clinton to victory. My prediction is Secretary Clinton + 2.
Ventura county:
As recently as 10 years ago, Ventura County leaned Republican but demographic changes have changed that. Not only has the Latino population grown to 42%, the formerly heavily Republican suburban areas such as Thousand Oaks have become more purple instead of solidly red (although Simi Valley is still solidly red). I expect Clinton to win here by +12.
Los Angeles County:
If Secretary Clinton wants a large margin out of California, Los Angeles will be the county where she needs it and she will get it. Besides Silver Lake and other young areas in LA County, there are few opportunities for Senator Sanders. There are upscale wealthy areas but they are unlikely to back Bernie (except maybe Santa Monica) due to not being as “anti establishment” as the progressive areas in Marin and Santa Cruz Counties. Not to mention Los Angeles County has a 48% Latino population and a 9% African American population that is very politically active. In 2008, Secretary Clinton won California by 12, I expect her to keep her 2008 voters (the groups she lost in 2016 compared to 2008 are working class white voters and there are few in LA County) and she will gain among African American voters and upscale white voters. Therefore, I predict a +16 win for Secretary Clinton here.
Orange County
This is a difficult county to predict. Orange County on one hand is home to a large Latino population (34%) and Asian population (16%) and also has many wealthy coastal areas as well that should favor Secretary Clinton. Secretary Clinton should be able to at least receive a +10 margin here thanks to margins from the coastal areas and from Latinos (although her margins among Latinos here may be smaller than in other areas thanks to the Latino population being younger here than in other parts of California).
San Diego County:
With San Diego being much whiter and younger, this is the SoCal county Sanders has the best chance to win (although I highly doubt he does). San Diego County has a large college aged population and has a larger white percentage than other SoCal counties (at 47% which also means that not a single county in SoCal is majority non Hispanic White). The 33% Latino population though is very helpful to Secretary Clinton and the 6% African American and 12% Asian do not hurt either here. Overall, Secretary Clinton should aim for a +8 win here.
Imperial County:
Predicting how Latinos will vote in California is difficult with Latinos having different voting patterns across the U.S. In Illinois, Sanders won the 75% Latino 4th district (but most of the Latino population was not Mexican) and Secretary Clinton won in heavily Latino parts of Florida and Texas (and probably won in Nevada but others debate that and that is another discussion for another article). I settled on Arizona, due to the similarities in the Latino population and the fact that both states are not caucus states (Nevada is). Yuma County and Santa Cruz County, the two heavily Latino counties in Arizona supported Secretary Clinton +29 and +32 respectively (similar to their 2008 primary results). While Senator Sanders has a chance to make inroads among urban Latinos, he has not shown this ability with rural ones. This is important in a 82% Latino county such as Imperial County. Therefore, I am predicting a +40 margin here for Secretary Clinton (similar to her +44 margin in 2008).
Conclusion:
Overall, Secretary Clinton should expect a +10 win statewide. She will sweep every county in SoCal with the closest being San Diego and Santa Barbara Counties. She will win the cities in the Central Valley (with the potential exception of Stanislaus County (Modesto) and while she will lose the Sierra rural areas, she may not lose by the large margins she lost by in rural western caucus states thanks to the large elderly population in these areas.
In NorCal, the race will be more split with Secretary Clinton winning the East Bay in the Bay Area, losing San Francisco and keeping it close in Santa Clara, San Mateo and Marin Counties.
In Coastal California, Bernie will win most of the counties except for Monterey.
California will be a gripping end to the primary season and while we may not know the final tallies for over a month (California takes about a month to finalize the provisional ballots and counts absentee ballots first which should favor Secretary Clinton in the early count), the absentee ballots and the Election Day votes should be enough to allow Secretary Clinton to declare victory.
Overall, the main reason I believe Secretary Clinton will win by 10 points in California is that in 2008, she won by eight points showing that she has a strong base here and Senator Sanders would need to make inroads among one of her demographics. I have not seen how Senator Sanders can do it.


