Showing posts with label Pennsylvania. Show all posts

Tuesday, December 6, 2016

What Happened in Pennsylvania?


In 2008, I was 14 years old and a proud supporter of then-Sen. Obama, I watched the Pennsylvania primary as then-Sen. Hillary Clinton swept the working class western part of the state as Obama swept the eastern part of Pennsylvania. In 2016, Clinton again won the Pennsylvania primary. I always viewed Pennsylvania as the consistent state that wavered, but in the end always sided with the Democrats. There were times when Republicans won in Pennsylvania such as Sen. Toomey (R) in 2010, but they won by making inroads in the Philadelphia suburbs. In 2012, however, Obama won Pennsylvania by five points despite  Romney’s inroads not only in the Philadelphia suburbs, but also in West Pennsylvania’s working class areas. It seemed impossible that Trump could win enough votes in West Pennsylvania to offset the Philadelphia suburbs that trended toward Clinton. Unfortunately, however, he did. Some analysts have blamed low Democratic turnout in Philadelphia for Clinton’s loss.

This article will analyze how Trump won Pennsylvania and examine many regions including: the Philadelphia metropolitan area, Southeast Pennsylvania (Harrisburg, Lancaster), West Pennsylvania (Pittsburgh, Erie) and Northeast Pennsylvania (Scranton, Poconos).

This is the second article of a series analyzing swing states post election. My Florida analysis can be found here:  

To receive my articles via email the instant they are published, we are now on mailchimp so sign up here:

Pennsylvania’s 2016 Two Party Vote:
Red: Trump by 20%+
Light Red: Trump by 10%-19%
Tan: Trump by 0%-9%
Light Blue: Clinton by 0%-9%
Blue: Clinton by 10%-19%
Dark Blue: Clinton by 20%+
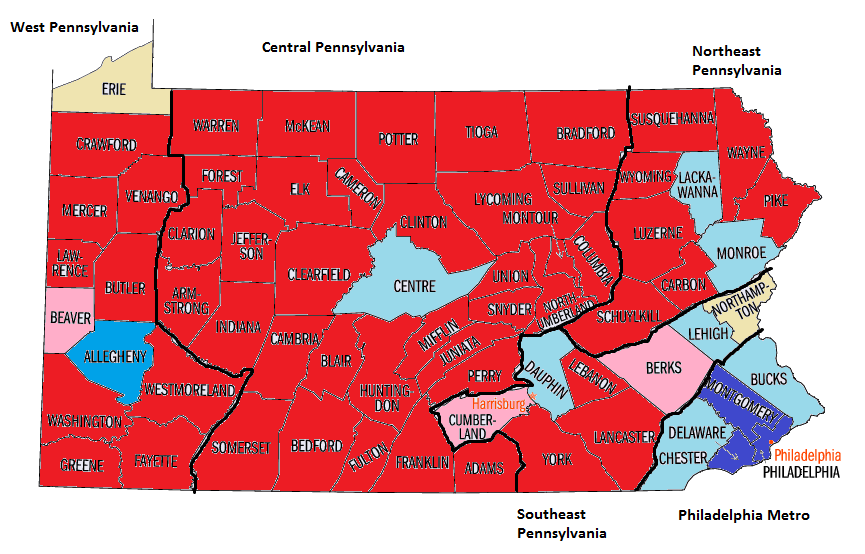
Pennsylvania County map actual.png
All election data used in the article can be found here and here:

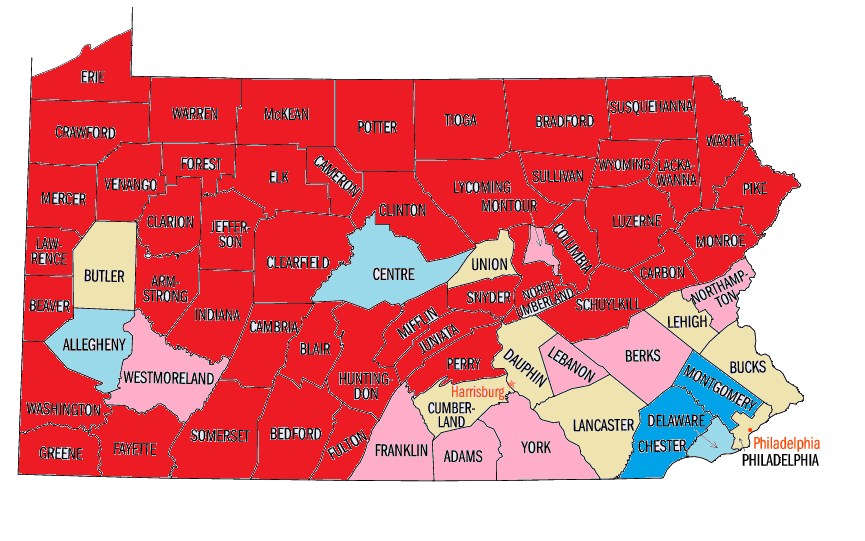
Shift in 2016 vs. 2012:
Red: 10+ gain for Trump
Light Red: 5%-9% gain for Trump
Tan: 0%-4% gain for Trump
Light Blue: 0%-4% gain for Clinton
Blue: 5%-9% gain for Clinton
Pennsylvania shift.png

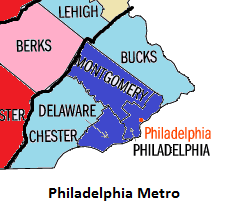
Philadelphia Metropolitan Area:
Philadelphia.png
Clinton’s strategy relied on increasing turnout in Philadelphia and its suburbs at such a high number that it would offset all of Trump’s gains throughout other parts of the state. Many analysts blame Clinton’s loss in Pennsylvania on low Philadelphia turnout. Clinton did garner less votes than Obama in 2012 in Philadelphia; her margin decreased by 17,000 votes (and it was only 2,000 votes lower than Obama’s 2008 margin in Philadelphia). Even if Clinton had won Philadelphia by the same margin as Obama in 2012 though, it would not be enough for her to win - so Philadelphia is not responsible for Clinton’s loss.

In fact, Clinton’s margin in the Philadelphia metropolitan area was higher than Obama’s margin. While her margin shrank by 17,000 votes in Philadelphia city proper, her margin in the Philadelphia suburbs ( historically a bellwether area) increased by 62,000 votes. She flipped historically Republican-leaning Chester County and increased Democratic margins in Montgomery County (31,000 votes) and Delaware County (6,000 votes). Even Bucks County-  a bellwether in all Senate, Gubernatorial and Presidential Elections since 2000- voted for Clinton. Bucks County is a mix of working class voters and wealthy suburbanites. Clinton still carried Bucks County by 3,000 votes.

Overall, Clinton won the Philadelphia metropolitan area by 659,000 votes and increased the Democratic margin by 45,000 votes, performing extremely well here and winning two thirds of the vote.  

Philadelphia data table:

Philadelphia data table.png
(for full data table click here:)

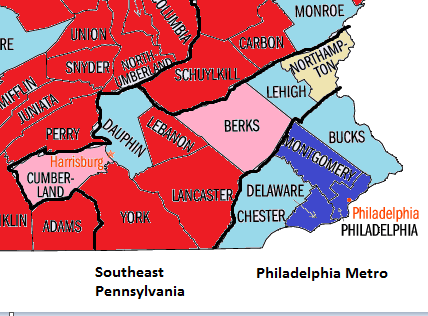
Southeast Pennsylvania
Southeast PA.png
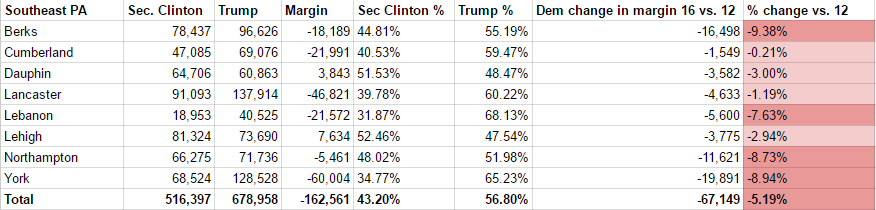
This region contains York, Lancaster, Lebanon, Dauphin, Cumberland, Berks, Northampton and Lehigh Counties. It is a Republican leaning area with a few Democratic pockets such as Dauphin County (Harrisburg) and Lehigh County (Allentown). Lehigh and Northampton Counties are historically bellwether and combined they voted for Clinton, suggesting that they may be trending more Democratic than the state as a whole. Their growing Latino populations (22% in Lehigh, 12% in Northampton) may be helping their Democratic trend relative to other working class areas in Pennsylvania with minimal or no Latino growth.

Trump increased the Republican margin in this region by 67,000 votes, but there is a warning sign. The trend in the Lancaster/Harrisburg area, while the counties did trend toward Trump, they were very narrow (Lancaster, Cumberland and Dauphin Counties  trended only one, one and three points respectively toward Trump). Lancaster County, a historically Republican county, gave George W. Bush a 71,000 vote margin in 2004, but gave Trump only a 47,000 vote margin in 2016. Cumberland County is a suburban county next to Harrisburg and is located in the region due to its connection to Harrisburg even though it may geographically fit in Central Pennsylvania. The surrounding counties such as York also gave strong margins to Bush in 2004, making  Pennsylvania close. Decreasing Republican margins in Lancaster and Cumberland Counties as well as keeping Dauphin County blue are key to Democrats ensuring that 2016 was a fluke and not the norm.

Southeast Pennsylvania Data Table:
Southeast PA data table.png
For full data table click here:

West Pennsylvania:
West Pennsylvania.png
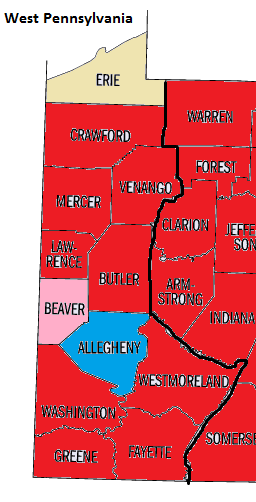
This region is one of the most famous regions within Pennsylvania politics, due to its voting trends and problems it has given the Democrats recently. In 2008, West Pennsylvania became well known when the Obama campaign worked hard there to ensure that he would not lose the state after his poor primary performance in West Pennsylvania.

Some definitions of West Pennsylvania extends its boundary further east into the Appalachian Mountains. This article’s definition includes the Pittsburgh area and the heavily unionized counties along the Ohio border such as Washington, Beaver and Erie Counties.

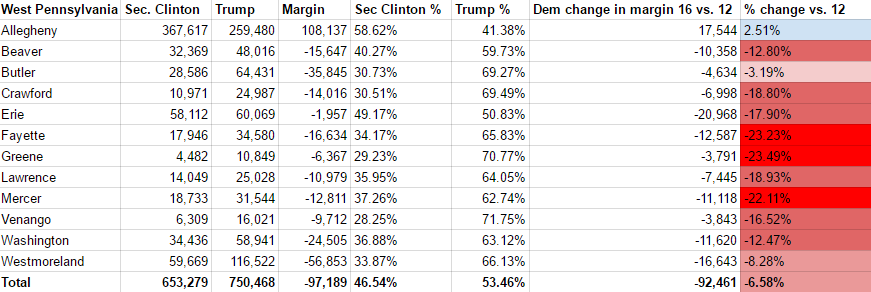
Despite Pittsburgh’s working class history which could spell trouble for Clinton, she actually increased the margin in Allegheny County (Pittsburgh) by 17,000 votes due to Pittsburgh’s changing downtown and wealthy suburbs that may be historically Republican but trended toward Clinton as did the Philadelphia suburbs. Trump did make gains in the heavily white industrial counties such as Beaver and Washington. He increased Republican margins there by 10,000 and 12,000 votes respectively. Trump also flipped historically Democratic Erie County which in 2012 had voted for Obama by 16 points.

Trump gained about seven points in West Pennsylvania, while making strong gains in the industrial counties, his gains were blunted a bit by Pittsburgh and its changing demographics. While West Pennsylvania is considered a large component of Trump’s gains, they were not as strong as the part of the state in the next paragraph.

West Pennsylvania Data Table:
West PA accurate data table.png
For full data table, click here:

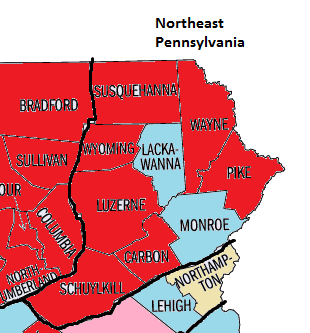
Northeast Pennsylvania:
Northeast PA.png
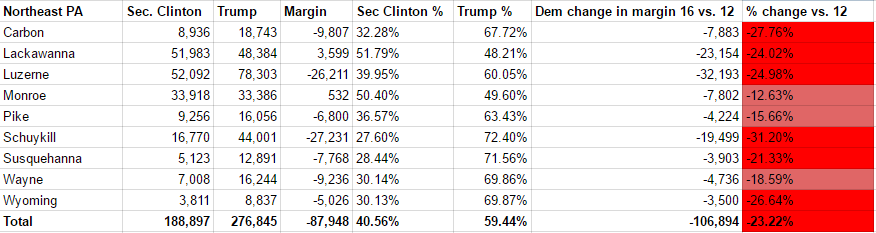
Many analysts suggest that Trump’s win was based on his margin from West Pennsylvania. As the results show, there was another area that trended more strongly for Trump: Northeast Pennsylvania around Scranton. In 2012, Romney’s disconnect with blue collar workers and Biden’s connection to Scranton may have prevented Romney from obtaining strong gains here (Obama actually improved in Scranton compared to 2008). Trump, however, made strong gains in Northeast Pennsylvania. While working class counties such as Beaver and Washington shifted about 12 points more Republican than 2012, working class counties in Northeast Pennsylvania shifted more than 20 points more Republican.

For example, Clinton did not need to win Susquehanna County, a heavily working class county in Northeast Pennsylvania.  She did not even need to lose narrowly, she could manage to lose by about 20 points which Obama did in 2012. Instead, she lost by over 40 points and lost by similar margins in many Pennsylvania counties demographically similar to Susquehanna. There were more stark examples for Clinton in Northeast Pennsylvania as well. The biggest swing was in Schuylkill County with a 31 point swing to Trump. Romney won by 14 points in 2012, Trump won by 45 points.

Even though Clinton flipped suburban Chester County near Philadelphia and won there by 25,000 votes, Trump flipped historically Democratic Luzerne County near Scranton and won there by 26,000 votes. Luzerne County is over 90% White and is heavily working class. While Bucks County is the historical bellwether in Pennsylvania, perhaps the new bellwether should be the combined votes of Luzerne and Chester Counties. A win in Chester County would show how strongly a candidate is performing in the Philadelphia suburbs as a Luzerne County win would show how strongly a candidate is performing in working class voters in Pennsylvania.

Obama won Northeast Pennsylvania by four points. If Trump won Northeast Pennsylvania by nine instead of 19 points, Clinton would have won Pennsylvania, even if the margins stayed the same in the other regions. Northeast Pennsylvania may have cast roughly 8% of the votes in Pennsylvania but its impact on the election was much greater than 8%.

Northeast Pennsylvania Data Table:
Northeast PA data table.png
For full data table click here:


Conclusion:
Overall, how was Trump able to win Pennsylvania?

At first glance, Trump should have lost Pennsylvania due to the historic losses he faced in the Philadelphia suburbs. He lost Bucks County which is normally a bellwether in not only Presidential, but also state elections. He also lost Chester County which Clinton flipped from 2012 and is normally more Republican than the rest of the state.

Trump made up some ground in West Pennsylvania where had had a seven point gain, he made some ground in Southeast Pennsylvania where had a six point gain and he also gained in Central Pennsylvania. The one area, though, that saw the fastest shift to Trump is Northeast Pennsylvania which voted for Obama by four points, but voted for Trump by 18 points. If the margins throughout the rest of Pennsylvania stayed consistent and there was only a 13 point shift to Trump  in Northeast Pennsylvania and Clinton lost by nine points there, she would have won Pennsylvania. Philadelphia is not the reason for Clinton’s loss, she could have matched Obama’s 2012 margin there and still lost.  While 2016 showed Democrats can produce strong margins in the Philadelphia suburbs, have high turnout in Philadelphia and can hold their own in parts of Southeast Pennsylvania, they need to devote more time and energy to more rural regions of Pennsylvania in order to win in 2018 and 2020, especially Northeast Pennsylvania.

Monday, April 25, 2016

Pennsylvania Primary Election Night Guide

On Tuesday April 19th, Hillary Clinton won New York by 16 points, further cementing her lead and pushing her closer to the nomination. The Sanders campaign has continued to press on claiming that they can win Pennsylvania and try to halt her momentum and push the argument that she will be a weak nominee. With Sanders expected to lose Delaware, Maryland and Connecticut (and win Rhode Island), a win in Pennsylvania could impact the direction of the race. Sanders has treated Pennsylvania as a major part of the race, he even gave his speech on the night of the NY primary here on April 19th showing that while his campaign knew he could not win New York, he would try hard to win Pennsylvania.
Overall, I expect Secretary Clinton to win Pennsylvania due to the similar demographics of New York but I expect a narrower margin (10%-12% instead of 16%) due to the smaller population of the Philadelphia area compared to the New York City population. This will be similar to the margin of her 2008 win where she won by ten points. The map though will be partially reversed from 2008 (in 2008, President Obama won Philadelphia, heavily African American areas and upscale Philadelphia suburbs while Secretary Clinton won strongly in rural and West PA). In 2016, I expect the votes to be partially reversed where Secretary Clinton performs well in Philadelphia, heavily African American and upscale areas while Sen. Sanders plays better (but not winning Secretary Clinton’s 70%+ margins) in rural and West PA.
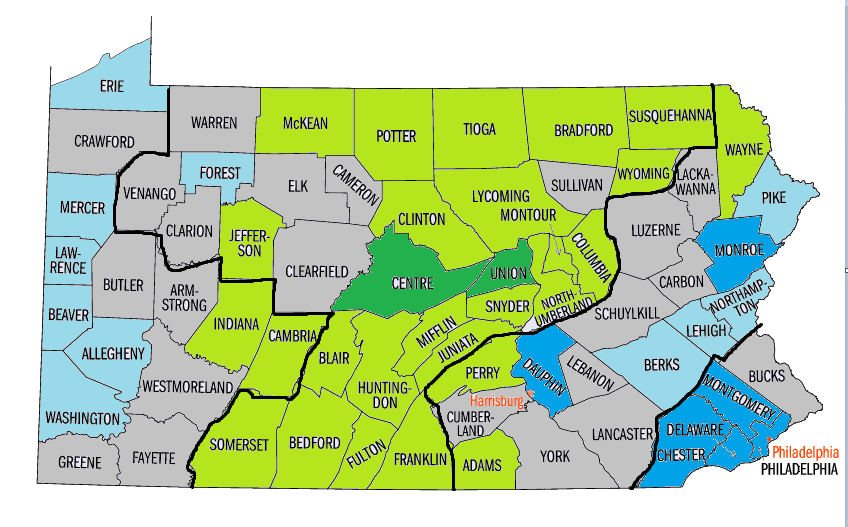
This is a county by county analysis of Pennsylvania which will predict which counties Secretary Clinton and Sen. Sanders will win.
Pennsylvania primary divided.png
Philadelphia Map 
Dark Blue = Strong Clinton
Light Blue = Leaning Clinton
Grey = Tossup/not enough data
Light Green = Leaning Sanders
Dark Green = Strong Sanders
The dark lines represent my divisions between the Philadelphia metro, Eastern PA, Rural PA and West PA.
Philadelphia  Metropolitan Area:
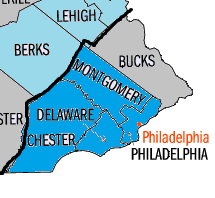
Philadelphia suburbs.png
Philadelphia Metropolitan area 
With the largest minority percentage in the state, a high population of wealthy white voters and a similarity to New York areas Secretary Clinton won, the Philadelphia metropolitan area should be Secretary Clinton’s strongest area in the state.
Philadelphia:
In 2008, Philadelphia was President Obama’s strongest county in the Pennsylvania primary. In 2016, it will likely be Secretary Clinton’s strongest county in Pennsylvania. The reason is that Philadelphia is 45% African American, 13% Latino and 35% White. With Secretary Clinton’s 75%-25% margin with African American voters in NY  and 60% win in Brooklyn with a 34% African American population, Secretary Clinton  will likely overperform that 60% number and could win 65% in Philadelphia, a reversal from Obama’s 65% win there in 2008.
Delaware County:
With a generally wealthy population and a 21% African American population, Secretary Clinton should expect a strong win here similar to Westchester County which has similar demographics with upscale white voters and African Americans. Secretary Clinton may not win here 2-1 where she did in Westchester but a 61%-62% win here is very possible. This could be Secretary Clinton’s best or one of her best counties in the state.
Montgomery County:
I expect a Hillary win here due to the similar demographics to wealthy NYC suburbs but with a lower African American population (9%) and a large college  aged population (Lower Merion Township). Sanders could keep it narrower here than Delaware County but barring a massive Secretary Clinton collapse he should be unable to win here. The wealthy Democrats as shown in Nassau and Westchester Counties should back Clinton.
Bucks County:
If Sanders carries one county in the Philadelphia suburbs, it will likely be this one. Bucks County is 85% White and has many liberal upscale white voters. It also has  more working class voters as well. Still, I expect a Clinton win although I expect it to be narrow.
Eastern Pennsylvania:
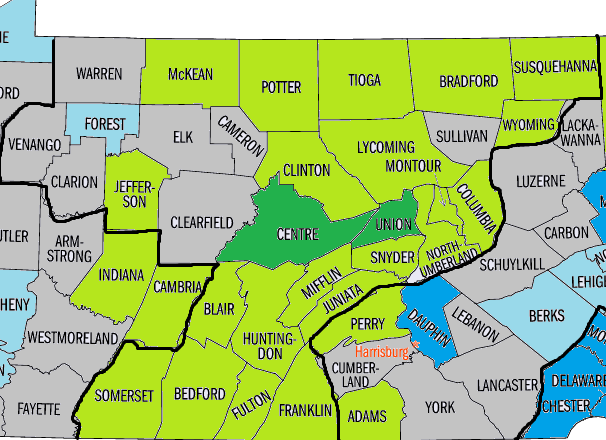
Eastern Pennsylvania.png
Eastern PA 
This area represents the counties west of the Philadelphia metropolitan area and east of the rural areas in the Appalachian Mountains. The cities in this area include: Harrisburg, Reading, Allentown/Bethlehem and Scranton. Secretary Clinton should perform well in these areas (although not as well as the Philadelphia metropolitan area) with help from the growing Hispanic and New York transplant population.
Lehigh/Northampton Counties:
I am grouping these two counties together due to being neighbors and similar in demographics. While Allentown/Bethlehem may appear to Sanders country at first due to being heavily working class towns, they also have a rapidly growing Hispanic population and in Lehigh County, the White population recently dropped below 70%(and the Hispanic population increased above 20%). These demographic changes should allow Secretary Clinton to win here.
Dauphin County:
With an 18.7% African American population (that helped propel Obama to a 58%  win here in 2008), Secretary Clinton should perform well  here. I expect a 55%-56% here for her. Harrisburg, the capital of Philadelphia is located here but unlike Albany (which Sanders narrowly won), it has a larger African American population.
Berks County:
After the Allentown area, Berks County is the most heavily Hispanic part of Pennsylvania. I expect Hillary Clinton to play well here, although I do not expect her to win by a large margin.
Lackawanna County:
While Scranton, a heavily working class area could appear to Sanders territory at a first glance, Secretary Clinton has some advantages here. She won 73% in 2008 here, Scranton has demographic similarities to the Youngstown, OH area Secretary Clinton won and her ancestors had roots here, something she highlighted in her 2008 campaign. While Sen. Sanders’s economic message will resonate with many voters here, it may be enough to keep it close but not enough to win.
Monroe County:
This county has had one of the most rapid demographic changes in Pennsylvania in the last couple of decades. Many New York transplants have moved in here and the Hispanic and AFrican American populations have increased to 15% each. The New York transplants moving in though are mostly upscale retirees who are more similar to Westchester County voters than southern Staten Island voters so they are more likely to support Secretary Clinton. The demographic trend is similar to a lesser extent in nearby Pike County as well.
Rural Pennsylvania:
West Pennsylvania.png
Rural PA 
James Carville once said, “Pennsylvania is Philadelphia in the East, Pittsburgh in the West and Alabama in the middle.” Central Pennsylvania may not have a large African American population similarly to Alabama but may be similar in other ways. One of the ways it is not similar though is in Secretary Clinton’s margin. She won Alabama with 78%, that will not happen here. This is Sanders’s best chance to win a region of Pennsylvania. I expect the votes in this area to be more similar to central rural Upstate (strongly pro Sanders) than to Ohio or western New York (narrowly pro Secretary Clinton). I listed many of the rural PA counties as “leaning Sanders” because most of the Upstate counties bordering PA supported Sanders but by narrow margins so I expect the central rural part of the state to vote roughly 54%-55% Sanders.
Centre County:
This could be Sen. Sanders’s best county in Pennsylvania. It is home to “State College” where Penn State is located and has a large rural population as well. There is a little diversity but Sen. Sanders’s strength with young voters should give him a win of around 60% here.
Sullivan County:
Secretary Clinton has the potential to pull off an upset here. The reason is that 27% of the county’s population is 65+ and polls such as NBC/WSJ/Marist and Monmouth show her leading 66%-28% among 45+ voters and 57%-33% respectively among 65+ voters respectively giving Secretary Clinton a chance to win rural counties such as Sullivan County.
Pittsburgh/West Pennsylvania:
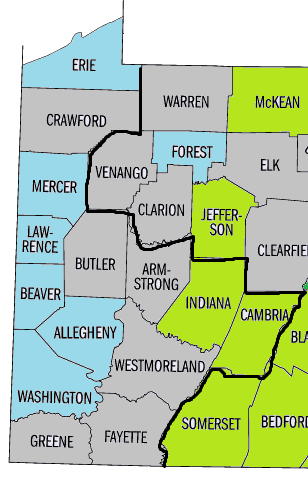
West Pennsylvania actual.png
West PA 
Western Pennsylvania should vote similarly to eastern Ohio and western New York. As shown by the numbers in Ohio and Western New York, western Pennsylvania will most likely be close but I expect a narrow Clinton win here. The reason  is that although Sanders did win most of western New York, his margins in Chautauqua County and Niagara County were narrow. These eastern Ohio results show that Secretary Clinton appears to do better in more urbanized working class areas while Sen. Sanders appears to do better in more rural ones as shown by Central New York. Also, the 65+ percentage of the population is higher here than in most Upstate counties. Central New York also has many similarities to Vermont, Sen. Sanders’s home state. Furthermore, many of the West PA Democrats tend to be more conservative than the rural Upstate voters who are more liberal.
Allegheny County:
With a 13% African American population and a small but growing base of wealthy white voters, Secretary Clinton could win here with a 10%-12% margin. Similarly to the 2008 primary, I expect Allegheny County’s results to mirror the state’s. With an African American population of 13%, working class white voters and upscale white voters, Allegheny County is a good representation of the state in the Democratic primary.
Erie County:
The Erie County in New York (with Buffalo) voted for Secretary Clinton by one point. Erie County, PA should be close as well with bordering Chattaqua County in NY voting for Sen. Sanders by eight points and Ashtabula County on the west voting for Secretary Clinton by 10 points. Overall, I expect a narrow Secretary Clinton win here but I would not be surprised if Sen. Sanders won here.
Conclusion:
Overall, I predict another Secretary Clinton win in PA, this time by 10-12 points.
Philadelphia area: Secretary Clinton wins Philadelphia overwhelmingly, wins all the suburbs with Bucks County being close.
Eastern Pennsylvania: Secretary Clinton wins most urban areas, she wins strongly in the Harrisburg area but might lose the Scranton area.
Rural Pennsylvania: while Sanders is likely to win, look for upsets in counties that are 20%+ 65 and older such as Sullivan and Forest Counties.
Western Pennsylvania: Secretary Clinton is likely to carry it due to the higher percentages of older voters than in Upstate New York and demographic similarity to Ohio counties that she narrowly carried.

Saturday, September 25, 2010

Joe Sestak and Campaign Surges

 In mid May, the whole pundit world was shocked as the "powerhouse" Arlen Specter (D) was knocked out of his Senate seat in the primary. Specter had previously held that Senate seat since 1980 as a Republican until 2009 but he still had the backing of Governor Ed Rendell (D). The successful challenger to Specter was former Admiral Joe Sestak (D) who represented PA-7, a district in the Philadelphia suburbs. In Pennsylvania races, it is nearly impossible for any Democrat to win unless he/she wins in the Philadelphia suburbs. In the primary, Sestak did just that, winning by 8% statewide with large margins in the Philadelphia suburbs. Although Specter won in Philadelphia with Rendell's help, the support did not carry into the Philadelphia suburbs. Sestak crushed Specter there and Sestak also won west Pennsylvania where Specter was never popular. At first, Sestak was losing in the polls because he had barely campaigned. Then close to the election, he started an ad blitz including some ads attacking Specter's party switch. Sestak learned that negative ads do work. Michael Castle's (R) negative ad blitz in Delaware was not so sucessful but that's another story.  I watched Sestak's acceptance speech and noticed how energetic he was. I watched Specter's concession speech and noticed how he had none of Sestak's energy. Sestak now faces former Allentown Rep. Pat Toomey (R). Conventional wisdom suggests that Republicans are shifting to the right to motivate the teabaggers like John McCain (R) but Toomey is not one of those Republicans. He has become a moderate (at least until November 2nd at 8pm) and keeps "forgetting" to mention how friendly he is with the Club for Growth.

So is Sestak barnstorming Pennsylvania like he was before the primary? Is Sestak out there addressing crowds, running ads everywhere telling voters how Toomey is too conservative for Pennsylvania? No, Sestak is running almost no ads except for a few in the Philadelphia media market. Is Sestak low on cash? Not exactly, Sestak has some money. So why is Sestak not using it so he can erase Toomey's 7 point lead that recent polls are showing? The answer is that he is hoping for a late surge. Most pundits believe that once the election gets closer, he will launch an ad blitz which will give him momentum in the polls. If the surge is close enough to election day, the voters will cast their votes before Sestak loses his surge. Also, Toomey will not have much time to respond to Sestak's surge and Toomey will have already spent most of his money. Yes, a surge does seem to be a comeback option for Sestak. The surge worked for him in the primaries where he won by 8 points. The question is will the surge work for Sestak again?

This year is a year filled with upsets and surges. In Delaware on September 14th, Christine O'Donnell (R) received a money surge and won by 6 points when most pundits expected her to lose. This surge though came only a few days before the election before Castle had enough time to respond. The difference though is that the Delaware election was a primary where surges happen more often. In primaries, many voters look for information themselves but in a general election, candidates need to give information to voters. Also, surges can happen when a new candidate jumps on the scene and initially excites everyone. If the candidate has been around for awhile, most people will have an opinion of the candidate so a big surge might not happen. A good example of how late surges do not work in general elections. In the Massachusetts Senatorial election in January, Martha Coakley (D) did not campaign for a couple of weeks while Scott Brown (R) was out on the air campaigning. A week before the election, Coakley realized the election was close so she started campaigning immediately. Unfortunately, she could not surge and lost by 5 points. The reason is probably that since voters knew both candidates, they had already made up their minds. Brown had an earlier surge which lasted long enough which helped make Brown's support deep.

Sestak though is starting to campaign a bit. He is running some ads in the Philadelphia media market. With the Governor's race looking like a loss for the Democrats, Sestak cannot rely on coattails and he needs to increase Democratic turnout in Philadelphia which often votes heavily Democratic. Still, he cannot wait until the last minute for a surge. Early voting starts very soon in Pennsylvania. Although many early voters are strong supporters of one of the parties, some Independents will vote early too and if they vote for Toomey, Sestak's not so early surge will be to blame. He needs to start campaigning now instead of waiting until most voters have made up their minds.