Showing posts with label Florida. Show all posts

Monday, November 28, 2016

What Happened in Florida?

One of the first political books I read was the Almanac of American Politics 2006 which I read as an 11 year old. It discussed how Democratic nominee Sen. John Kerry increased Democratic turnout in Democratic parts of Ohio compared to Vice President Gore in 2000. Kerry increased turnout in Cuyahoga County (Cleveland), Franklin County (Columbus) and overperformed in Hamilton County (Cincinnati). According to the Almanac, if President Bush’s margins in the Republican rural areas had remained the same compared to 2000, the passage said, Kerry would have won Ohio by 17,000 votes and thus the Presidency. Kerry lost Ohio by 119,000 votes because Bush had increased Republican margins in heavily Republican areas.

A similar phenomenon happened in Florida 2016: Secretary Clinton increased her margins in almost every Democratic county, especially in the Gold Coast region. Those margins could have given her a strong win compared to President Obama’s 2012 win and her win would have been in line with  polls showing her with a 2%-3% win. Donald Trump, however, won Florida by about one point because he increased turnout in heavily Republican areas.

This article will analyze how Trump was able to win Florida and how Democrats can win Florida for the 2018 midterms and the 2020 Presidential Election. This article will break down Florida into a few regions: the Gold Coast (the Miami, Fort Lauderdale and Palm Beach area), the I-4 Corridor (the counties along Interstate 4), the rest of Florida and a sub-region: North Central Florida.

Map of Florida’s 2016 results:
Dark Red: Trump 20%+
Red: Trump 10%-19%
Tan: Trump 0%-9%
Light Blue: Clinton 0%-9%
Blue: Clinton 10%-19%
Dark Blue: Clinton 20%+
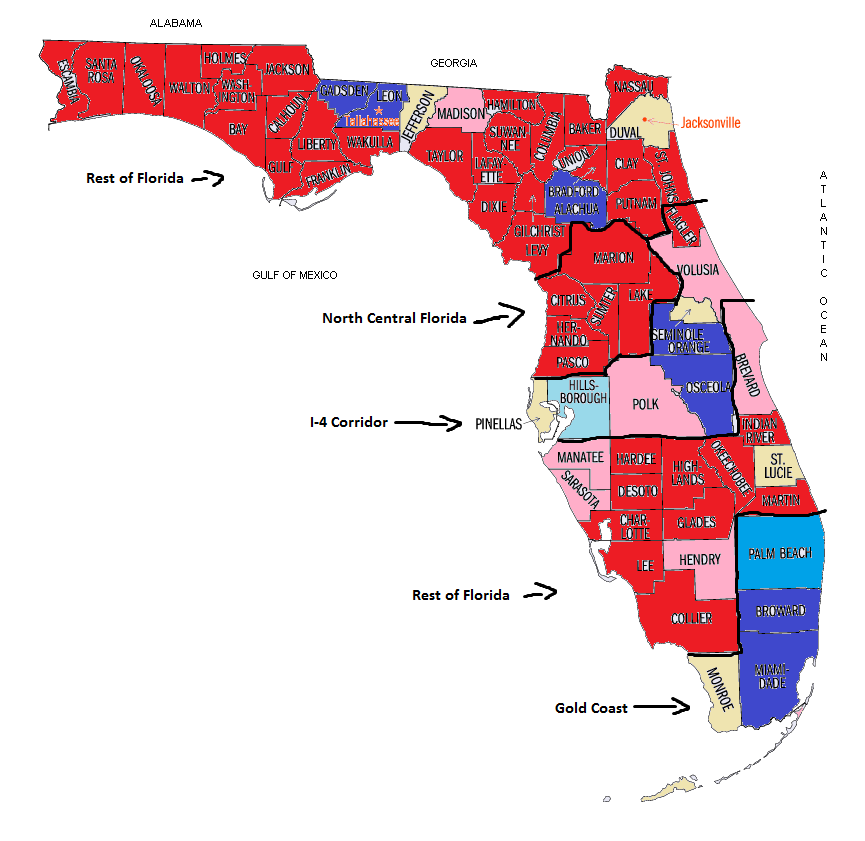
Florida Map.png
Map of Florida’s trends 2016 vs. 2012  
Dark Red: 10+ point gain for Trump
Red: 5%-9% gain for Trump
Tan: 0%-4% gain for Trump
Light Blue: 0%-4% gain for Clinton
Blue: 5%-9% gain for Clinton
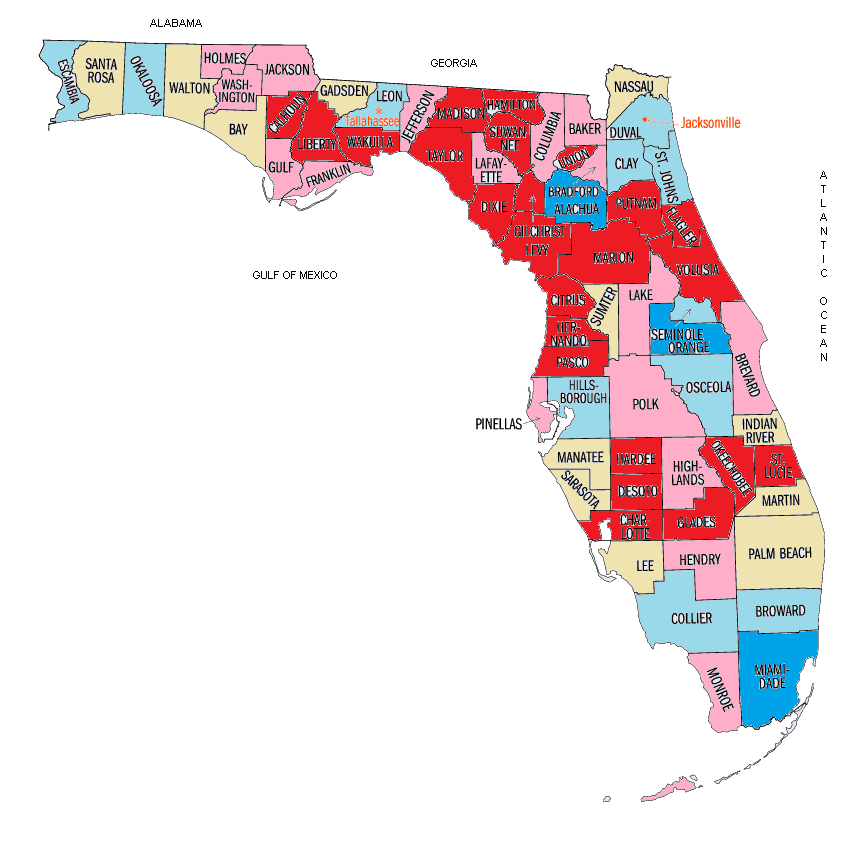
Florida trend 2016 vs. 2012.png

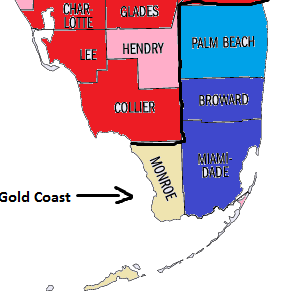
The Gold Coast:
Gold Coast Map.png
The Gold Coast (Palm Beach, Broward, Monroe and Miami Dade Counties) is Florida’s most densely populated region and where Democrats earn the bulk of their margins. While demographics may not have been enough to win Florida, they are enough to produce historic margins in the Gold Coast. One theme as to why Clinton lost Florida is that she performed poorly among Cuban voters. While she may not have won Cuban voters, she outperformed Obama in Miami Dade County which is home to Florida’s highest population of Cuban voters.

While Clinton’s margin in Palm Beach County remained static, she increased her margin over  Obama’s by 28,000 votes in Broward County which has a rapidly shrinking white population (it is at 39% compared to 57% in 2000). Broward County is also the 2nd most populous county in Florida. Where Clinton overperformed Obama the most is in Miami Dade County, home to nearly one out of seven Floridians. She won a margin of 290,000 votes there and 63% of the vote, 82,000 higher than Obama’s in 2012. This represents a long term shift toward the Democrats in Miami Dade County. As recently as 2000, Gore won Miami Dade County by only 39,000 votes and by only seven points. Miami Dade also has a 67% Latinx population with a high Cuban population and although Cubans are historically primarily Republican, many Cubans, especially younger ones have started voting Democratic.

Gold Coast Data Table: (all election data is from the U.S. Election Atlas and New York Times)

Gold Coast Table.png
For full data tables click here:


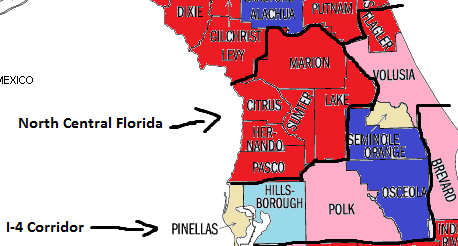
I-4 Corridor:
I-4 Corridor.png
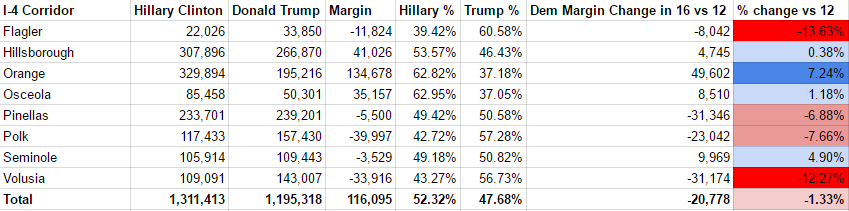
The I-4 Corridor is defined by the author as the counties of Pinellas, Hillsborough, Polk, Osceola, Orange, Seminole, Volusia and Flagler. This fast growing area with the Tampa metropolitan area (Hillsborough and Pinellas Counties), the Orlando metropolitan area (Orange, Osceola and Seminole Counties) and the Daytona Beach area (Volusia and Flagler Counties) is historically a swing area in Florida. It is home to Hillsborough County (Tampa) which from 1964 to 2012 voted for the presidential winner of Florida. This year, however,  Clinton won Hillsborough County even though she did not win Florida.

One narrative suggests that Clinton lost the election because she was unable to turnout Latinx voters. While Latinx turnout may vary from state to state, she did not lose Florida due to Latinx turnout. In fact, Clinton nearly flipped historically Republican Seminole County, losing by only two points and Democrats gained Seminole County’s congressional seat which was held for 20+ years by a Republican, due to the Latinx growth in Seminole County (it was at 20% in 2015, compared to 17% in 2010). Also, Clinton won Orange and Osceola Counties by 29 and 25 points respectively (Orange contains Orlando with a large Puerto Rican population and Osceola is suburban with a rapidly growing Puerto Rican population and a 51% Latinx population). Thus, with a combined 171,000 vote margin from the two counties, Clinton increased her margin over President Obama’s by 57,000 votes.

If margins in the counties outside of the Gold Coast and Orange/Osceola Counties did not change compared to the 2012 election, Clinton would have won by 237,000 votes in Florida, matching President Obama’s 2008 margin and matching many of the pre-election polls.

As we have seen, that did not happen and the I-4 Corridor reflects this. Trump gained votes in heavily white Pinellas, Volusia, and Flagler Counties. Each of the three counties has an above-average elderly population, and each is over 70% White. Volusia County for example went for Romney by one point in 2012 but in 2016 went for Trump by 13 points (the author also has relatives who live there). Even though Clinton nearly flipped Seminole County, Trump was able to flip Pinellas County in the Tampa Area with a 75% White population.  Trump was able to reduce the Democratic margin in the I-4 Corridor and to help offset Clinton’s gains in the Orlando area.

I-4 Corridor Data Table:
I-4 Corridor Table.png
For full data tables click here:

Rest of the State:
The rest of Florida contains retirement areas along the West Coast, the Panhandle, some East Coast of Florida communities and the Jacksonville area. Some analysts say that a low turnout among African Americans hurt Clinton, but the results show that did occur at least in urban areas. Clinton overperformed Obama in Duval County (Jacksonville) where she lost by 6,000 votes compared to Obama’s 16,000 vote loss in 2012 (Duval County has a 30% African American population). Clinton also overperformed Obama in Alachua County (University of Florida) which has a 21% African American population as well as a higher number of millennials. She also matched Obama’s numbers in Southwest Florida which is more wealthy. In contrast, Trump won large margins throughout the rest of the West Coast, the Florida East Coast north of Palm Beach County and the heavily Republican Panhandle.

Many analysts blame Trump’s win on the heavily conservative Panhandle that reported late and erased Clinton’s narrow statewide lead. The Panhandle voted heavily for Trump and he received roughly an 186,000 vote margin from the five counties on the northwest part of the Panhandle (Escambia, Santa Rosa, Okaloosa, Walton and Bay Counties) which is higher than his 113,000 statewide win. The Panhandle, however, is not responsible for turning Florida red compared to 2012 because the Panhandle was already heavily Republican and voted heavily for Romney in 2012 as well (he received roughly a 168,000 vote margin). These counties border Alabama, are culturally very southern, have voted extremely Republican for decades so there are less swing voters to persuade and less new Republicans to turn out compared to other Florida regions. Trump’s margins in the Panhandle were expected, yet they were not responsible for flipping Florida. One of the major regions responsible for Trump’s win in Florida is what I describe as “North Central Florida.”

North Central Florida
North Central Florida.png

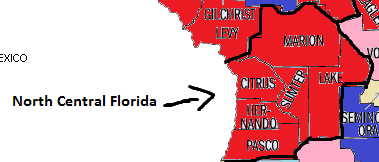
My previous Florida analyses have not singled out this area, instead dividing Florida into the “Gold Coast”, “I-4 Corridor” and “Rest of the State” but six counties I describe as the “North Central Florida” area are key due to the unmistakable Trump trend and demographic similarities. The counties are Citrus, Hernando, Lake, Pasco, Sumter and Marion. They are mostly part of Florida’s old 5th Congressional District from the 2000s and all of the counties have  high retiree populations as evidenced by the high 65+ population ranging from 22% in Pasco County to 54% in Sumter County (which is partially home to the Villages, a large and fast growing retirement community).

These six counties are all located directly north of the I-4 Corridor and in the 2000s were extremely fast growing, slowed during the recession but have started seeing new growth post recession. They are all >70% White and have a large population of Midwesterners. In 2000,  Gore won two of these counties, in 2008 Obama was close in Pasco County. It may be noted that Lake County is closely connected to the I-4 Corridor due to its proximity to Orlando, but it is included with the other five counties north of Tampa due to demographic similarities with a high population of retirees and a low minority population (Lake County also contains part of the Villages).

In 2016, however, these counties gave Trump a 226,000 vote margin with 64% of the two party vote and a roughly 115,000 margin gain over Romney’s margin in the area  (111,000 votes with 58% of the two party vote). That 115,000 increase in 2016 compared to 2012 is higher than Trump’s statewide 113,000 vote margin. If the Republican margins in these six counties stayed stable compared to 2012, Clinton would have won Florida, although by roughly 2,000 votes, a situation similar to the 2000 election.

Gore won two of these six counties and even Obama in 2012 came close in Pasco and Hernando Counties. As recently as 2014, Charlie Crist (D) who ran for Governor (and lost by one point) lost Pasco County by one point and lost Hernando County by three points.The 2014 Gubernatorial race was a bit of a reverse of the 2016 Presidential race where Crist lost narrowly in >70% White counties such as Pasco, Hernando and Volusia Counties but lost because he could not run up the score in heavily Latinx areas such as Osceola and Miami Dade counties. Overall, both Obama and former Governor Crist show that, although difficult,  Democrats can narrow the margins in these six counties.


North Central Florida Data Table:

North Central Florida Table.png
For full data tables click here:

Conclusion:

Overall, how was Trump able to win Florida?

He was able to produce stunning margins from unexpected areas. Clinton was able to overperform Obama on the Gold Coast, heavily Latinx areas such as Osceola and Orange Counties and even in areas with high African American populations such as Broward and Duval (Jacksonville) Counties. If Trump received the same margins Romney received in all the counties outside of the Gold Coast plus Orange and Osceola, Clinton would have won Florida by 237,000 votes matching President Obama’s 2008 margin. Trump’s win relied on increased turnout in Florida’s West Coast and North Central area above Romney’s numbers, mainly in areas that were >70% White with a high population of former Midwesterners. Republicans such as Romney in the previous election made improvements with white voters, but those were mainly white rural voters north of Ocala which are culturally southern. Trump made those same improvements in areas with high populations of former Midwesterners.


As shown by the high turnout numbers in the Gold Coast and the Orlando area, the reservoir of new Democratic voters may be drying. Therefore, in order to win in 2018 and 2020, Democrats need to ensure that their margins in the counties just north of the I-4 Corridor such as Pasco, Hernando, Sumter and Lake return to President Obama’s 2012 levels.

Tuesday, March 15, 2016

Key Counties to Watch on the March 15th Primaries


The  Super Tuesday 2.0 is here and there are 691 delegates at stake. As  my friend calls it, “Significant Tuesday.” This is a chance for Hillary to secure her 200+ pledged delegate lead or for Sanders to prolong the race. Pundits expect Clinton to win Florida and North Carolina easily while Ohio, Illinois and Missouri should be close (although a few pundits say Sanders will win Missouri). Here are the key counties and regions to watch while the results unfold (on the Democratic side only).

Florida:
Florida is expected to go strongly for Hillary Clinton. The RCP polling average shows Hillary with a  29 point lead. The three main regions are: Gold Coast, I-4 Corridor and outstate Florida.  Hillary should perform well in outstate, mainly because of the high African American population in northern Florida, the elderly voters in the Villages and the wealthy voters on the southwest coast of Florida. She is also expected to do well in  the Gold Coast (Miami) with the high Hispanic, African American and elderly populations. Counties Sanders can try to score an upset:

Alachua County: the University of Florida is here but a  high African American population is here as well. This county will be close.

Counties north of Tampa: counties such as Pasco, Hernando and Citrus are heavily white and not as wealthy as the southwest coast of Florida. These have similar demographics to counties Bernie won in Michigan (and Midwestern transplants). At the same time, the percentage of elderly voters here is almost the highest in the nation so it is likely Bernie cannot even win here.

North Carolina:
This is another state where Hillary is expected to perform well, this time with a 24 point lead in the RCP average. Hillary should perform well in the eastern part of the state due to the high African American population. She should do well in the urban areas of  Raleigh/Greensboro/Charlotte as well. If Bernie wins a few counties, he needs to perform well in:

Western North Carolina: this is Appalachia with a low African American population but as shown in Tennessee, Georgia and Virginia, Hillary wins southern rural white voters.

Durham and Orange Counties: Duke and UNC are here but so are high African American populations.

Charlotte suburbs: Gaston and Union Counties  voted for Hillary by narrow margins in 08. These are heavily white and upscale suburban counties. If Bernie wants to make inroads among the upscale voters he needs to win these.

Ohio:
Here we go to our first  swing state of the evening. The RCP average has Hillary with an 8 point lead but after Michigan, it is highly unlikely that the Clinton folks are taking any chances. Ohio though will probably not be a Michigan repeat because Independents are represented in these polls. Also, Michigan has only one large urban area, Ohio however has:

Cuyahoga County (Cleveland): this county is the center of Ohio’s Democratic base. Obama won here by 260,000 votes in 2008, Kerry won here by 227,000  votes in 2004. It is about 30% African American. Hillary will need those votes and if she wins Cuyahoga County with a margin of 57% or higher, she will probably win statewide. Obama won 54% here with his 8 point loss in 2008.

Franklin County: (Columbus) Franklin County used to be a swing county (Gore won by a few point) but as shown in 2012 (Obama won it by 20) it has become strongly Democratic. It is the 2nd most populous county in Ohio (after Cuyahoga). Obama won 56% here but expect Hillary to do worse because while there is a large African American population (20% of the county), there is a large population of college students as well. There are upscale Democrats  too so Hillary should win (although narrowly). If she loses, expect a good night for Bernie.

Hamilton County (Cincinnati): Hamilton is the 3rd most populated county in Ohio and it was also Obama’s best. With a low number of white Democrats and a 23% African American population, Hillary  should aim to at least match Obama’s percentages in the low 60s.

Lucas County (Toledo): Toledo is a smaller city (Lucas County has roughly 480k people) and Obama lost it by 5 points in 2008 but Hillary should win here. The reason is that she lost Monroe County, Michigan (which borders Toledo) by only one point and Monroe County has a lower African American population than Lucas County does. It depends how big the Hillary win is here though.

Summit County (Akron): this is a county to watch. It has a 13% African American population and a large number of working class union voters who may lean Sanders. Hillary can probably win Ohio without Summit county but if she wins it, Bernie cannot win.

Sanders should do well in the rural part of the state, but Hillary can make a play for:

Southeast Ohio: this is a heavily white and rural area. Hillary though showed that she can win Appalachian voters on March 1st so if she can win northern Appalachian voters and score some surprise wins in rural areas, this is the area to watch. It  voted heavily for her in 08.

Illinois:
This is another close state. Despite a high African American population (15%), a large number of upscale voters and high Obama popularity, Illinois could be a tough state for Hillary. The RCP average has her winning by 2.3 points and the trusty PPP poll has her leading by 3. Here are the key counties to watch:

Cook County (Chicago): nearly half of the state’s Democratic votes live here. Hillary wants a large margin from the south side with its high African American population. She also wants to do well in northern Cook County with upscale Democrats near Evanston similar to the upscale Dems in Massachusetts that helped her win there. Sanders though is making a play for Hispanics, young African Americans and working class voters. He also is tying Hillary to the unpopular mayor Rahm Emanuel.  If Hillary wins Cook County by 5 points or less, she should be worried.

Lake County: is Hillary winning upscale voters? Look no further than Lake County which is north of Cook County, is upscale and suburban. I was phone banking for Hillary here and found mostly Hillary supporters but I do not know how they targeted the voters. Hillary will also look to do well in other upscale areas such as McHenry and DuPage. If she loses Lake County though and gets a five point or lower win in Cook, she will lose Illinois.

Downstate: this is rural Illinois and Sanders needs large margins in the rural areas to win. Hillary though could try to score some upsets in:
-St. Clair/Madison Counties: these are St. Louis suburbs with some heavily African American areas.
-Sangamon County: this is Springfield which also has some heavily African American neighborhoods.
-Pulaski County: this county is 30% African American and at the southern tip of Illinois. This was the only part of Illinois Hillary won in 08 so watch her try to repeat her win there.

Missouri:
This is the state Sanders has the best chance to win. With the state being only 11% African American and having a large white working class population, this is tough terrain for Hillary. PP has  Sanders winning by one point. Nate Silver says Hillary has a 54% chance of winning here.

St. Louis City: African Americans are about half the population here but there are many younger white Democrats as well. Hillary should win here but if her  margin is under 60% she should be concerned.

St. Louis County: with upscale voters, a 20% African American population and Ferguson, Hillary should win here. She also needs to keep her percentage above 60%. Obama won 63% here in his narrow Missouri win.

Jackson County (Kansas City): although there is an African American population in the 20s here, it is more working class and borders Kansas where Bernie performed well. If Hillary loses this county, she is in trouble.

Rural Missouri: although Hillary won rural Iowa on the Missouri border, that may have been more due to her ground game. Sanders should perform well in this part of the state. Hillary though can score some wins in rural counties in southeastern Missouri which border her husband’s home state Arkansas and a few counties in southeast Missouri such as New Madrid have  significant African American populations as well.

Friday, July 17, 2015

Florida Redistricting from the Democratic Perspective

Earlier in July, Democrats got exciting news! The Florida congressional map the Republicans drew was ruled unconstitutional by the Florida Supreme Court, meaning that the legislature would have to redraw the districts. The specific districts are the 5th, 10th, 13th, 14th, 20-22 and 25-27. The 5th district needs to be redrawn because it has a tendril from Jacksonville traveling nearly 200 miles south to Orlando. The 14th and 13th district because the 14th represents Tampa but goes into Pinellas County to keep heavily African American areas out of the swing 13th district. 20-22 because of how Hendry County (rural southern Florida) is split and how 21-22 need to be north/south instead of east/west. 25 because of Hendry County, 26-27 because the city of Homestead should not be split. In 2010, 63% of Florida's voters passed the "Fair Districts Amendment" that would force the legislature to not consider partisanship when redrawing lines. They should have passed a measure similar to California's where they have a commission with Democrats and Republicans who need to draw a map together. That would  prevent any underlying partisan agenda. The 2012 map had that though as shown by packing Democrats into the 5th and 14th districts but my redraw will attempt to redraw the map fairly and represent communities of interest (communities with similar issues, demographics and proximity) as much as possible. This is similar to the California model which has compact districts following the VRA, representing communities of interest and having many competitive districts.

I know this map is hypothetical because as history shows, Republicans will try to prevent Democratic gains in Florida as much as possible. This map though is what the Democrats should propose as a map that follows all the rules of the Florida Supreme Court's requirements and is not a gerrymander (I will post a Florida gerrymander soon but that is an entirely different diary and much more hypothetical). 

Florida's current map (before the changes): https://www.govtrack.us/congress/members/FL

The map: (with Gainesville in 5th district)

Data (with Gainesville in 5th distict)


(all data on this map is either from Dave's Redistricting App or from Stephen Wolf, an editor for Daily Kos Elections). 

Notes: the 2012 Presidential data was calculated by county and trends were extrapolated from 2008 data so the 2012 data may not be 100% accurate for large counties such as Miami Dade. 

Florida's 1st District: Jeff Miller (R) Safe R (blue)
No change, moving along now. Democrats will win Utah before they win this district.

(with Gainesville option)

The Gainesville option is when the 5th district is redrawn "east to west" by combining Gainesville which is the west and creating an African American 18+ that is higher than 50% of the district's Democratic vote to give them a majority in the primary. Gainesville is west but it is also south (the Supreme Court asked the legislature to not draw south) but Gainesville is closer to Jacksonville, is more of a community of interest and a district combining both would be more compact. At the same time, the court may require a district to Tallahassee in order to ensure that an African American is elected to the House.

Florida's 2nd District Gwen Graham (D) Tilt Democratic (Green)

(18+ population) 68% W, 24% AA, 5% H
Obama 47.8%, McCain 52.2%
Obama 47.3%, Romney 52.7%

Graham will undoubtedly face a tough race in this district that President Obama lost both times. I expect a vary narrow win for her however due to how she was able to win this district in 2014 when Democrats across the country were losing. She was one of the two Democrats to defeat a Republican incumbent in 2014.


Florida's 3rd District Ted Yoho (R) Safe Republican

(18+ population) 785 W, 13% AA, 6% H
Obama 33.4%, McCain 66.6%
Obama 32.1%, Romney 67.9%

Undoubtedly one of the biggest winners here, Yoho maintains most of his current district and remains safe from any Democratic challenge and most likely safe from a primary challenge.


Florida's 4th District Ander Crenshaw (R) Safe Republican

18+ population 81% W, 9% AA, 6% H
Obama 34.7%, McCain 65.3%
Obama 32.9%, Romney 67.1%

Still heavily Republican, still representing suburban Jacksonville. Crenshaw should have no worries.


Florida' 5th District Corrine Brown (D) Safe Democratic

(18+ population) 53% W, 33% AA, 8% H
Obama 62.7%, McCain 37.3%
Obama 61.3%, Romney 38.7%

This district represents parts of Jacksonville and Gainesville with high African American populations. The change in district territory may prompt a primary challenger. Without having run a competitive race in nearly 20 years and only $22,000 in the bank account, Brown is in a tight spot. The district though will likely have an African American majority in the Democratic primary which may be what the commission requires to elect an African American Democrat.


Florida's 11th District Rich Nugent (R) Safe Republican

(18+ population) 84% W, 6% AA, 8% H
Obama 43.4%, McCain 56.6%
Obama 40.4%, Romney 59.6%

(without Gainesville option)


Data (without Gainesville option)


Florida's 2nd District: Vacant (Ted Yoho (R)?) Safe R
(18+ population) W 80%, AA 12%, H 4%
Obama 34.1%, McCain 65.9%
Obama 33.4%, Romney 66.6%

The 2nd district becomes more Republican with the removal of Tallahassee and the addition of Republican rural counties in the central northern part of Florida. While these counties may be less Republican downballot, long gone are the days when Democrats could win a 34% Obama district. Gwen Graham (D) is the incumbent but she will not run here without her Tallahassee base. A Republican will succeed her. 

+1 Republican. 

Florida's 3rd District: Ted Yoho (R)? Safe R
(18+ population) W 72%, AA 14%, H 8%
Obama 45.1%, McCain 54.9%
Obama 42.5%, Romney 57.5%

The 3rd district drops from 61% to 57% Romney with the addition of all of heavily Democratic Gainesville. At the same time, the district represents heavily Republican Jacksonville suburbs in Clay and St. Johns County with no history of electing Democrats. Rep. Yoho can say "yahoo" because he is not losing to a Democrat in this 57% Romney district (but he should watch out for a primary). 

Florida's 4th District Ander Crenshaw (R) Safe R
(18+ population) W 78%, AA 10%, H 6%
Obama 36.1%, McCain 63.9%
Obama 34.6%, Romney 65.4%

The 4th district loses heavily Republican precincts in Clay County and exchanges them for more heavily Republican precincts in St. Johns County (and a few Democratic precincts in St. Augustine). While I feel bad for my Democratic relatives in St. Augustine, this district will remain safely Republican. 

Florida's 5th District Gwen Graham (D) vs. Corrine Brown (D) Tossup between two Democrats
(18+ population) W 47.2% AA 42.4% H 6.0%
Obama 64.5%, McCain 35.5%
Obama 63.9%, Romney 36.1%

While an ideal Democratic proposal would not link Tallahassee and Jacksonville, the court's decision required "east to west" so if the Democrats chose that interpretation, they would draw this district. The new 5th district loses the snake to Orlando and Gainesville and instead gains a snake through some rural counties to Tallahassee. It is impossible to draw an African American pluarity seat so I opted for a minority majority seat. Rep. Brown represents Jacksonville and Rep. Graham represents Tallahassee and they will likely primary each other. Brown has fought against dismantling her gerrymandered district and netting an extra Democratic seat in Orlando. Also, Graham could run for Governor in 2018 and she won a swing district in 2014, the worst possible year for Democrats showing she has the skills to win statewide. So I am obviously supporting Graham. Most of the Democratic primary (roughly 60%-66%) should be African American, potentially making it difficult for Graham but Brown has only raised $22,000 and Graham won a difficult race in 2014 (Brown has not won a competitive race in over 20 years) so Graham has a chance. Furthermore, another African American candidate could see Brown's weakness and run, creating an easier path for Graham. 

Florida's 6th District Vacant Tossup/Tilt Democratic
(18+ population) W 76%, AA 11%, H 10%
Obama 53.2%, McCain 46.8%
Obama 49.9%, Romney 50.1%

The 6th district loses heavily Republican Putnam and St. Johns Counties and gains Democratic leaning Deltona in Volusia County and Democratic Sanford in Seminole County. These changes bring Romney's margin from 16.4% to 0.2%, making it the closest district in Florida in the 2012 Presidential election. Both Flagler and Volusia Counties in the district are swing counties, supporting Obama in 2008 narrowly and Romney in 2012 narrowly. The district also better represents communities of interest because the old district combined Jacksonville suburbs with Daytona Beach nearly 100 miles away while the new one combines Orlando suburbs only 30 miles away from Daytona. The representative for the old 6th district (58% Romney) is freshman Ron DeSantis (R) who is running for Senate. A potential Democratic candidate for the 6th district is young Daytona Beach mayor Derrick Henry (D) who represents the largest city in the district and the center of Volusia County, one of the closest counties in Florida. The Republicans may nominate one of the many legislators from Flagler and Volusia Counties. Expect both parties to heavily invest in this district. In the end, I expect a very narrow Democratic win because it will be a Presidential year and the Democrats won 48% of the House vote here in 2012 even though neither district was contested by Democrats. This district could flip in 2018.

+0 Democrats (1 Gainesville)


Tampa/Orlando

Florida's 7th District John Mica (R) Safe Republican
(18+ population) W 73%, AA 8%, H 14%
Obama 45.8%, McCain 54.2%
Obama 44.2%, Romney 55.8%

Rep. Mica's district trades Democratic Sanford for Republican Lake County. Life is good for him, 

Florida's 8th District Bill Posey (R) Safe Republican
No change. 

Florida's 9th District Vacant (Darren Soto (D)?) 
W 44%, AA 9%, H 41%
Obama 60.5%, McCain 39.5%
Obama 61.7%, Romney 38.3%
With current Rep. Alan Grayson (D) running for Senate and making life harder for fellow Senate candidate Rep. Patrick Murphy (D), there will be a primary here. Soto as a legislator who ran previously has a strong shot. 

Florida 10th District Rep. Daniel Webster (R) vs. Val Demmings (D)?) Safe Democratic
(18+ population) 51% W, 24% AA, 18% Hispanic
Obama 59.6%, McCain 40.4%
Obama 59.4%, Romney 40.6%

The new 10th district unites the heavily African American neighborhoods in Orlando with nearby Orange County neighborhoods instead of Jacksonville neighborhoods more than 100 miles away from Orlando. As a result, the 10th now voted 59% for Obama. Rep. Webster can either run here and get demolished by 2012 candidate and former Orlando Police Chief Val Demmings (D) (she lost by 4 points in 2012 in Webster's 54-46 Romney district, running ahead of President Obama showing she is a strong candidate) or Webster can run in the 7th which contains a small percentage of his current district and get demolished by the entrenched Rep, Mica. Life is not good for Webster. 

+1 Democrats (2 Gainesville)

Florida's 11th District Rich Nugent (R) Safe Republican
(18+ population) W 86%, AA 5%, H 7%
Obama 42.5%, McCain 57.5%
Obama 39.6%, Romney 60.4%

Other than a few adjustments in Republican Marion County, the 11th does not change. It remains safely Republican. 

Florida's 12th District Gus Bilrakis (R) Safe Republican
(18+ population) W 83%, AA 3%, H 9%
Obama 47.9%, McCain 52.1%
Obama 46.6%, Romney 53.4%

Other than a few minor adjustments in southern Pinellas and easternn Pasco Counties, the district does not change and remains heavily Republican downballot. 

Florida's 13th District Vacant Likely Democratic
(18+ population) W 78%, AA 11%, H 7%
Obama 56.3%, McCain 43.7%
Obama 55.0%, Romney 45.0%

Originally, the old 13th District voted for President Obama by 2 points in 2012 and represented all of southern Pinellas County except for some heavily African American neighborhoods in St. Petersburg which were placed in the 14th district representing Hillsborough. This violated communities of interest and partisan intent so the 13th gained the heavily African American neighborhoods. Rep. David Jolly (R) bailed and is running in the Republican Senate primary which seems to get new candidates each minute. Former Gov. Charlie Crist (D) suggested he may run for the 13th. He won Pinellas County by 11 points in his 2014 Gubernatorial bid so he has a strong chance to win. 

+1 Democrats

Florida's 14th District Kathy Castor (D) Safe Democratic 
(18+ population) 49% W, 19% AA, 26% Hispanic
Obama 61.7%, McCain 38.3%
Obama 61.5%, Romney 38.5%

The district is entirely within Hillsborough County,  representing communities of interest with Tampa and its close in suburbs. The 14th remains safely Democratic. 

Florida's 15th District Dennis Ross (R) Safe Republican
18+ population 71% W, 12% AA, 14% H
Obama 44.4%, McCain 55.6%
Obama 44.1%, Romney 55.9%

The district makes a few small adjustments but remains Republican and safe for Ross. 

Florida's 16th District Vern Buchanan (R) Safe Republican 
18+ population 80% W, 6% AA, 12% H
Obama 48.5%, McCain 51.5%
Obama 45.7%, Romney 54.3%

The district extends into Hillsborough County in order to prevent the 17th District from violating communities of interest and representing part of Hillsborough County. The district shifts 0.5% more Democratic and while the district saw competitive races in the late 2000s, Buchanan appears entrenched and should be safe. 

Florida's 17th District Tom Rooney (R) Safe Republican
18+ population 76% W, 7% AA, 14% H
Obama 44.3%, McCain 55.7%
Obama 41.9%, Romney 58.1%

The district swaps rural Hendry County for part of coastal Lee County and remains strongly Republican. 

Florida's 18th District Vacant Tossup
No Change

This district voted narrowly for Romney in 2012 and narrowly for President Obama in 2008. Rep. Murphy (D) won here in 2014 by 20 points however showing that voters here will side with a Democrat who brings the right message. The race is still developing.

South Florida


Florida's 19th District Curt Clawson (R) Safe Republican
18+ population 78% W, 6% AA, 14% H
Obama 43.3%, McCain 56.7%
Obama 40.0%, Romney 60.0%

Very minor changes here. The 19th lost a few Collier County precincts and gained a few in Lee. It still remains heavily Republican. 

Florida's  20th District Alcee Hastings (D) Safe Democratic
18+ population 30% W, 47% AA, 19% H
Obama 81.5%, McCain 18.5%
Obama 80.9%, Romney 19.1%

A few small changes but still remains majority African American and heavily Democratic. Moving along...


Florida's 21st District Ted Deutch (D)? Safe Democratic

18+ population W 68%, AA 10%, H 17%
Obama 58.4%, McCain 41.6%
Obama 58.0%, Romney 42.0%

The district loses all of Broward County and gains Palm Beach coastline, becoming a few points more Republican but remains Democratic.


Florida's 22nd District Lois Frankel (D)? Safe Democratic

18+ population W 68%, AA 10%, H 18%
Obama 62.7%, McCain 37.3%
Obama 59.3%, Romney 40.7%

This district gains the more Jewish parts of Broward County. It remains strongly Democratic.


Florida's 23rd District Debbie Wasserman Schultz (D) Safe Democratic

No changes.

Florida's 24th District Frederica Wilson (D) Safe Democratic

No changes, Frederica Wilson will continue to delight the capitol with her hats.


South Florida zoomed in


Florida's 25th District Mario Diaz Barlet (R) Safe Republican

18+ population W 24%, AA 5%, H 68%
Obama 43.6%, McCain 56.4%
Obama 44.5%, Romney 55.5%
There are very minor changes as it loses Hendry County for VRA reasons. The Democrats will not dismantle the string to heavily Republican Collier County in order to keep swingy FL-18 within Palm Beach County.

Florida's 26th District Carlos Cueblo (R) Lean Democratic

18+ population W 20%, AA 11%, H 66%
Obama 54.3%, McCain 45.7%
Obama 57.3%, Romney 42.7%

This district becomes more Democratic as it gains areas with non Cuban Hispanics and consolidates communities of interest by representing neighborhoods below Highway 90 instead of simply splitting Democratic and Republican ones with the 27th. With these changes, the 2008 Obama percentage increases from 49.5% to 54.3%. I wanted to add more heavily Cuban areas around University Park into the 27th which would increase the Democratic percentage to 56% but that would increase teh 27th district to 80% Hispanic which could generate a lawsuit for packing. My goal was to keep the 26th district at 65% Hispanic or higher. Democrats won this district in 2012 and lost it in 2014 but with these changes, this already swingy district is now more Democratic and should elect one.


+3 Democrats (4 for Gainesville)

Florida's 27th District Illeana Ros Lehtinen (R) Safe Republican
18+ population 17% W, 3% AA, 78% H
Obama 44.7%, McCain 55.3%
Obama 48.6%, Romney 51.4%

Rather than waiting for entrenched and moderate Lehtinen to retire, the 27th district becomes more Republican and combines more communities of interest within the Miami area. This is Lehtinen's district for as long as she wants.


Overall, the Democrats will gain 1-3 seats under the new map, depending on how FL-18 and FL-6 vote. If the court upholds the Gainesville option, then the number increases to 2-4 seats. This could give the Democrats as many as 14 seats or as few as 11, depending how 2016 is.