On May 18th, everyone called that day the Super Tuesday for primaries. They apparently were not thinking about this Tuesday, June 8th. Today, about a dozen states are holding their primaries. Some states like Virginia only have primaries for House and State legislature while states like Arkansas have very contested Senatorial primaries. The state I will examine is my home state, California. Today, we have important primaries for many of our statewide seats. California had the potential to have even more. First, Jerry Brown sealed the Democratic nomination once Newsom dropped out of the primary although polls showed he did not have a strong chance. Although no one has dropped out of the Gubernatorial and Senatorial Republican primaries, Fiorina and Whitman are leading by more than 20 points in most polls. In March, Whitman was leading by 40 points and in early May, her lead was in the single digits. She came ahead again by writing herself another check so she has spent the most money of any candidate ever. Fiorina earned her money after running Hewlett Packard to the ground and she is now using that to defeat Tom Campbell and Chuck DeVore. I see Chuck DeVore signs all around but he is not winning, he just has very enthusiastic supporters. The races I will examine are both Attorney General Primaries, the Lieutenant Governor priamry and Prop 16. I will discuss what to watch in each of them and here are the three most important factors: turnout, turnout and turnout.
For the Democrats Attorney General primary, the candidates are San Francisco Attorney Kamala Harris, Facebook's former privacy officer Chris Kelly, Rocky Delgadillo from the Los Angeles area, Pedro Nava from Santa Barbara and Ted Lieu. The three main candidates are Harris, Kelly and Delgadillo although polls show the race is between Kelly and Harris. A recent Survey USA poll showed Harris leading by 6 points. For Harris to win, she needs to win big margins in the Bay Area. Kelly should win big in the Los Angeles area although Harris received the LA Times endorsement. Delgadillo though might steal votes from Kelly, especially among Hispanics. The Survey USA poll has Kelly and Delgadillo tied in the Inland Empire. While watching the returns, ask yourself these questions: is Harris getting the margins she needs in the Bay Area and the Central Valley? Is Kelly winning in the Inland Empire or is he tied with Delgadillo? Most importantly, is Kelly crushing Harris in Los Angeles or is it a three way tie?
In the Republican Attorney General primary, Steve Cooley from Los Angeles goes against Orange County State Senator Tom Harman and teabagger John Eastman. Cooley is the more moderate candidate and he is establishment backed. This resembles many previous primaries this year where most people voted for teabaggers. The problem was that the teabagger divided the vote, allowing the establishment candidate to receive the nomination. This may happen in this election because a recent Survey USA poll showed Cooley leading by five points. Although Cooley is popular in the Los Angeles area, Eastman should win Orange County because he is from there. The Survey USA poll shows Harman leading in Northern California even though he has no strong connection to the area. Remember to ask yourself these questions while the results arrive: how high is the Los Angeles area turnout? Is Harman actually winning in the Bay Area and the Central Valley or is Eastman splitting the vote with him? Most importantly, who is winning the Inland Empire?
The Lieutenant Governor primaries are less active. For the Republicans, moderate Abel Maldonado is leading against Nevada County conservative Sam Aanestad. Maldonado has his Central Valley state Senate open with a close race brewing. This is another blog post for another time though. The Democrats have a more interesting race. San Francisco Mayor Gavin Newsom faces Janice Hahn, the sister of a former Los Angeles mayor. Although the Hahn family is popular in LA, the LA Times endorsed Newsom. Although Newsom should probably win by getting high turnout from the Bay Area, Hahn may get close if there is low turnout. Newsom needs to win big margins in Northern California while keeping down her margins in Southern California. Although the state’s main political divide is Coastal vs. Inland California in the general election now, the primaries still have the NorCal vs. SoCal divide. While the results come in, ask yourself these questions: Is Hahn winning LA County by more than 30 points? Is Newsom winning the Bay Area by more than 30 points? If Hahn is winning the Inland Empire, is she winning it in the double digits? Most importantly, how high is the Bay Area turnout?
Prop 16 is the last race I will examine but it is very intriguing. PG&E put Prop 16 on the ballot and they are spending $46 million so it will pass. The ads claim it is about the taxpayers right to vote but they “forget” to mention it has to be 2/3 of the taxpayers. If passed, PG&E has its competition eliminated and it can raise electricity rates. If a county does not like that and wants to start a new electricity provider, it will not be able to. PG&E will start spending to prevent 2/3 of the people from supporting a new one and PG&E should get at least 1/3 of the voters to support PG&E. A Survey USA poll had the No side leading by 4 points. The poll also showed that minorities are split on their opinions of Prop 16 as well as LA County. Also, a good number of Republicans are against Prop 16 but many Democrats are for it. I would expect San Diego and Orange Counties to go strongly for Prop 16 because many people there care about taxes. The poll also showed the Central Valley mostly opposing Prop 16. You should remember these questions to ask yourself while the results come in: is the Central Valley actually opposing Prop 16? How high is the margin and the turnout in the Bay Area? Most importantly, which side is winning LA County?
Tuesday, June 8, 2010


Monday, May 31, 2010
How Pat Quinn Wins
A Quick note: this is my first post in a long time that focuses on race analysis without too many demographics. I used to have posts similar to this one in 2008 and early 2009 but I stopped because the horse race world was quiet. Now that election day is coming closer, I will do race analysis posts similar to my 2008 ones. Also, I will soon bring back the Senatorial and Gubernatorial rankings. Now onto the post:
In Illinois, Rod Blagojevich (D) was impeached in early 2009 because he tried to sell Obama's Senate seat. Pat Quinn (D), the Lieutenant Governor replaced him. Now Quinn faces Downstate State Senator Bill Brady (R) who is very conservative. Brady won an upset by 200 votes in a crowded field in the February primary with big margins Downstate but he was crushed in the Chicagoland area. The campaign has barely started but Quinn is getting off to a poor start. Recently, he replaced his running mate Scott Lee Cohen (D) because Cohen was accused of domestic violence. The new candidate, Sheila Simon (D) is a professor from Downstate and yes, she is the daughter of the late Senator (not singer) Paul Simon (D). Although no poll have been released on this race since May 2nd, all polls show Brady with a high single digit or low double digit lead. Yes, Pat Quinn is behind but he can still pull off a win. Here is what he needs to do:
- Distance himself from Blagojevich as much as possible. To do this, he needs to highlight how he was isolated from the Governor and did not speak with him for all of 2008. Also, he needs to highlight how Blagojevich said Quinn was not a member of Blagojevich's administration in 2006.
- Highlight his ethical background: where he launched a panel to examine corruption in the University of Illinois. Also, he should highlight how he never used state money to pay for his trips, meals and hotel stays. If Pat Quinn wants to win, he needs to demonstrate he is not another corrupt Chicago politician.
- Make the race about Brady: Quinn needs to paint Brady as who really is; a downstate social conservative. He needs to run ads showing Brady wants to eliminate the State Board of Education and how Brady voted against increasing the minimum wage.
- Campaign hard in the suburbs: Quinn is from Chicago while Brady is from Bloomington which is Downstate. Brady should win almost every county (if not every county) in Downstate so Quinn needs to win as many suburban voters as possible.
- Highlight Brady's positions while campaigning in the suburbs: Quinn needs to highlight how Brady opposes abortion even in cases of rape and that Brady voted against a bill to ban gay discrimination not with marriage but in the workplace. Brady even voted against a bill to increase funding for stem cell research and supports teaching intelligent design. Brady even supports concealed handguns and Chicago is mostly pro gun control. These are the issues that made the suburbs trend towards the Democratis in the 1990's. Although the social issues will motivate Democrats to turn out and vote, Quinn should not get carried away because the main issue for voters is the economy and jobs. If he can make his campaign in the suburbs half about Brady's social issues but half about how Quinn will create jobs, Quinn should win.
- Do not bring up his tea parties unless they are absolutely necessary: in 1978, Quinn told people to send teabags to the current Illinois Governor due to state legislator pay raises. He could say he was one of the first real tea party people but this should depress Democratic turnout and Brady will win Downstate anyway.
Overall, Quinn should prove he is more connected to Chicagoland issues than Brady is but Quinn needs to define himself instead of being the "not Brady" candidate. Yes, Downstate is important and Democrats need to win in rural areas in states like Missouri to win elections. In Illinois though, Chicagoland has so many people so a Democrat can do well there, get crushed in Downstate but still win.
Please feel free to share your thoughts.
Please feel free to share your thoughts.
Saturday, May 29, 2010
Oregon Gubernatorial Baselines
In Oregon, Ted Kulogoshi (D) is not running for reelection as Governor. The Democrat running to replace him is John Kitzhaber (D) who is the former Governor of Oregon from 1994 to 2002. The Republican running is former basketball player Chris Dudley. Kitzhaber was a popular Governor and he was elected with 64% of the vote in 1998. A recent Rasmussen poll though showed Kitzhaber and Dudley tied. Kitzhaber should still win because Rasmussen has recently shown polls that favor Republicans. For the Arkansas Senatorial race, they found Republican John Boozmen winning against incumbent Blanche Lincoln (D) by 38 points. Other polls show Boozmen winning by 10-15 points. For Oregon, other polls show Kitzhaber with a lead. This is an anti incumbent year but Kitzhaber has not been an incumbent for eight years. He was not very popular but Oregon has a strong Democratic lean so Kitzhaber should probably pull ahead.
For Kitzhaber to win, he needs to win big margins in Portland while carrying suburban Washington and Clackamas combined. He is from Portland but Dudley is from Lake Oswego in Clackamas County. Also, Kitzhaber needs to win traditionally Democratic rural counties like Clatsop and Tillamook counties where he performed very well in 1998. He hopefully will keep down Dudley's margins in the rural eastern part of the state.
This map here is the baselines of the Gubernatorial race. This map shows how the Oregon counties will vote if the Gubernatorial race is tied. I found the results by adding the 2008 Presidential election results to the 1998 Gubernatorial election results. I then divided by two to get the results shown below.
Link for 1998 election results: http://www.uselectionatlas.org/RESULTS/
Link for 2008 election results: http://www.uselectionatlas.org/RESULTS/
Here is a map of the baselines
 Dark Blue: Kitzhaber 60%+
Blue: Kitzhaber 50%+
Light Red: Dudley 50%+
Red: Dudley 60%+
Dark Red: Dudley 70%+
Now here is a chart of the percentages by county. The formatting is not working but it should not be too hard to follow.
Counties Kitzhaber Dudley
Baker 32% 68%
Benton 57% 43%
Clackamas 48% 52%
Clatsop 54% 46%
Columbia 50% 50%
Coos 43% 57%
Crook 32% 68%
Curry 39% 61%
Deschutes 42% 58%
Douglas 36% 64%
Gilliam 43% 57%
Grant 27% 73%
Harney 26% 74%
Hood River 55% 45%
Jackson 44% 56%
Jefferson 42% 58%
Josephine 35% 65%
Klamath 29% 71%
Lake 26% 74%
Lane 56% 44%
Lincoln 54% 46%
Linn 40% 60%
Malheur 25% 75%
Marion 46% 54%
Morrow 40% 60%
Multnomah 66% 34%
Polk 45% 55%
Sherman 40% 60%
Tillamook 51% 49%
Umatilla 40% 60%
Union 38% 62%
Wallowa 33% 67%
Wasco 50% 50%
Washington 52% 48%
Wheeler 34% 66%
Yamhill 44% 56%
For Kitzhaber to win, he needs to win big margins in Portland while carrying suburban Washington and Clackamas combined. He is from Portland but Dudley is from Lake Oswego in Clackamas County. Also, Kitzhaber needs to win traditionally Democratic rural counties like Clatsop and Tillamook counties where he performed very well in 1998. He hopefully will keep down Dudley's margins in the rural eastern part of the state.
This map here is the baselines of the Gubernatorial race. This map shows how the Oregon counties will vote if the Gubernatorial race is tied. I found the results by adding the 2008 Presidential election results to the 1998 Gubernatorial election results. I then divided by two to get the results shown below.
Link for 1998 election results: http://www.uselectionatlas.org/RESULTS/
Link for 2008 election results: http://www.uselectionatlas.org/RESULTS/
Here is a map of the baselines

Blue: Kitzhaber 50%+
Light Red: Dudley 50%+
Red: Dudley 60%+
Dark Red: Dudley 70%+
Now here is a chart of the percentages by county. The formatting is not working but it should not be too hard to follow.
Counties Kitzhaber Dudley
Baker 32% 68%
Benton 57% 43%
Clackamas 48% 52%
Clatsop 54% 46%
Columbia 50% 50%
Coos 43% 57%
Crook 32% 68%
Curry 39% 61%
Deschutes 42% 58%
Douglas 36% 64%
Gilliam 43% 57%
Grant 27% 73%
Harney 26% 74%
Hood River 55% 45%
Jackson 44% 56%
Jefferson 42% 58%
Josephine 35% 65%
Klamath 29% 71%
Lake 26% 74%
Lane 56% 44%
Lincoln 54% 46%
Linn 40% 60%
Malheur 25% 75%
Marion 46% 54%
Morrow 40% 60%
Multnomah 66% 34%
Polk 45% 55%
Sherman 40% 60%
Tillamook 51% 49%
Umatilla 40% 60%
Union 38% 62%
Wallowa 33% 67%
Wasco 50% 50%
Washington 52% 48%
Wheeler 34% 66%
Yamhill 44% 56%
Saturday, May 22, 2010
California Redistricting
(Beware, this post is very long so read if you are not in a rush.)
First, this is finally finished! It took me a couple of months to map and write, including when half of the write up mysteriously vanished.
This is a hypothetical map but I wanted to see how big a Democratic gerrymander I could create. I tried to keep only seven Republicans safe while making the other seats winnable for the Democrats. Although 2010 is definitely looking like a bad year for the Democrats, 2012 with Obama on the ticket should be better. 2010 should be better than expected but that's another story. I drew this map assuming California has 53 congressional districts after the census. Yes, I know that keeping only seven Republicans safe could turn into a dummymander because I weakened too many Democrats. I hope to avoid that and I made current Democrats safe. Many of the shakier seats should trend Democratic overtime so the Democrats will be able to pick up all the seats I made for them sometime in the decade if not 2012. I created 33 Safe Democratic, 9 Likely Democratic, 3 Lean Democratic, 2 Toss Up, 1 Likely Republican and 6 Safe Republican seats. Besides the Republican district, Obama does not win less than 53% of the vote in any district. He wins 53% in only one and 54% in two. Also, I gave the Hispanics four new districts while increasing the Asian population in the 31st district and 15th district. I also protected two of LA's three African American representatives. Diane Watson is retiring so I made her district more Hispanic so the 34th and 36th districts will be more African American but the Hispanics will get an extra district.
(if the photo is not fitting on the blog, click it for the full picture. I apoligize for the poor quailty)

1st District Mike Thompson (D) St. HelenaFirst, this is finally finished! It took me a couple of months to map and write, including when half of the write up mysteriously vanished.
This is a hypothetical map but I wanted to see how big a Democratic gerrymander I could create. I tried to keep only seven Republicans safe while making the other seats winnable for the Democrats. Although 2010 is definitely looking like a bad year for the Democrats, 2012 with Obama on the ticket should be better. 2010 should be better than expected but that's another story. I drew this map assuming California has 53 congressional districts after the census. Yes, I know that keeping only seven Republicans safe could turn into a dummymander because I weakened too many Democrats. I hope to avoid that and I made current Democrats safe. Many of the shakier seats should trend Democratic overtime so the Democrats will be able to pick up all the seats I made for them sometime in the decade if not 2012. I created 33 Safe Democratic, 9 Likely Democratic, 3 Lean Democratic, 2 Toss Up, 1 Likely Republican and 6 Safe Republican seats. Besides the Republican district, Obama does not win less than 53% of the vote in any district. He wins 53% in only one and 54% in two. Also, I gave the Hispanics four new districts while increasing the Asian population in the 31st district and 15th district. I also protected two of LA's three African American representatives. Diane Watson is retiring so I made her district more Hispanic so the 34th and 36th districts will be more African American but the Hispanics will get an extra district.
(if the photo is not fitting on the blog, click it for the full picture. I apoligize for the poor quailty)

Obama 203,307 62% McCain 117,072 36%
Change: McCain +8
Demographics: 13% Hispanic, 78% White
Communities of Interest: Redding, Santa Rosa, Eureka
Status: Safe Democratic
I removed most of Napa County except for Thompson's home in St. Helena. I also added most of heavily Republican Shasta County. The North Coast keeps the district safely Democratic though.
2nd District Wally Herger (R) Chico
Obama 160,489 55%, McCain 122,712 43%
Change: Obama +24
Demographics: 16% Hispanic, 5% Asian, 72% White
Communities of Interest: Redding, Chico, Davis
Status: Lean Democratic
Herger's seat makes a big turn to the left because I removed Shasta County and Republican parts of Butte County. I added parts of Democratic Sonoma and Yolo Counties. Herger is unfamiliar with these areas so he should have trouble making inroads in them. Although he still has his home in the district, I should say he will lose by seven points to a strong challenger.

3rd district Dan Lungren (R) Folsom
Obama 148,675 56% McCain 110,520 42%
Change: Obama +14
Demographics: 7% African American, 14% Hispanic, 7% Asian and 67% White
Communities of Interest: Sacramento, Folsom, Citrus Heights
Status: Likely Democratic
Lungren is already shaky in his current 49%-49% seat so a 56% Obama seat would be too Democratic for him. I added parts of Sacramento where he is not entrenched while removing Republican areas outside of Sacramento County. A strong challenger in 2012 when Obama is on the ballot should be able to knock off Lungren.
4th District Tom McClintock (R) Granite Bay
Obama 149,211 41% McCain 203,357 57%
Change: McCain +6
Demographics: 8% Hispanic, 85% White
Communities of Interest: Roseville, Lincoln, Rocklin
Status: Safe Republican
The only real change is that McClintock loses the Democratic Lake Tahoe area. He gets even safer with the addition of more Republican areas.

5th District Doris Matsui (D) Sacramento
Obama 165,279 62% McCain 96,765 36%
Change: McCain +16
Demographics: 12% African American, 17% Hispanic, 16% Asian, 50% White
Communities of Interest: Sacramento, Elk Grove,
Status: Safe Democratic
Although her district picks up some moderate Sacramento suburbs, her district still remains strong for her with a base in Sacramento.
(click for full picture)

6th District Lynn Woolsey (D) Petaluma
Obama 223,326 68% McCain 99,268 30%
Change: McCain +16
Demographics: 18% Hispanic, 5% Asian, 71% White
Communities of Interest: San Rafael, Petaluma, Napa, Yuba City
Status: Safe Democratic
First, this is my home district! I am not too pleased with this district because Central Valley Democrats will have an influence over voters next to San Francisco. The district is still anchored in the North Bay so when Woolsey retires, a North Bay Democrat will replace her. A good candidate is Jared Huffman, a liberal State Assembly member from Marin County which cast 48% of the district's Obama votes with 1/3 of the district's population. Marin County does not have a representative in the State Senate or the House so when Woolsey retires, Marin probably will have one in the House (finally.)
7th District George Miller (D) Martinez
Obama 182,391 68%, McCain 83,750 31%
Change: McCain +8
Demographics: 14% African American, 20% Hispanic, 14% Asian, 46% White
Communities of Interest: Vallejo, Fairfield, Pittsburg
Status: Safe Democratic
George Miller loses most of Richmond and gains all of Solano County which drops the Obama percentage a bit but Miller is still safe.

8th District Nancy Pelosi (D) San Francisco
Obama 282,287 85%, McCain 41,850 12%
Change: McCain +0
Demographics: 8% African American, 15% Hispanic, 29% Asian, 44% White
Communities of Interest: San Francisco
Status: Safe Democratic
Keeping all of San Francisco except part of the Sunset District, the district does not change a bit.
9th District Barbara Lee (D) Oakland
Obama 249,791 84%, McCain 41,860 14%
Change: McCain +8
Demographics: 27% African American, 19% Hispanic, 14% Asian and 36% White
Communities of Interest: Oakland, Berkeley, Lafayette
Status: Safe Democratic
Lee's district gets a bit more Republican by going into the less Democratic cities in the San Ramon Valley such as Danville and Orinda but still stays extremely safe.
10th District John Garamendi (D)
Obama 208,364 65% McCain 108,189 33%
Change: McCain +0
Demographics: 15% Hispanic, 9% Asian, 67% White
Communities of Interest: El Cerrito, Concord, Antioch, Lodi
Status: Safe Democratic
This district keeps its anchor in north-central Contra Costa County but gains mostly white but heavily Democratic neighborhoods in Oakland and goes further into the Central Valley to pick up Republican parts of San Joaquin County. Also for Garamendi, the district picks up a few more precincts in Sacramento County.
11th District Jerry McNerney (D) Pleasanton
Obama 164,551 58% McCain 115,845 40%
Change: Obama +8
Demographics: 5% African American, 19% Hispanic, 11% Asian, 61% White
Communities of Interest: Pleasanton, Oakley, Tracy
Status: Likely Democratic
McNerney gets safer. I was able to give him Democratic Castro Valley and Oakley while removing the Republican area around Lodi. I slipped in Livermore too because Tauscher does not represent the 10th anymore and she wanted Livermore in her district. McNerney also picks up a few precincts in Stockton from the 18th district. Most of McNerney's old territory is in the district too.
12th District Jackie Speier (D) Hillsborough
Obama 216,684 74% McCain 70,455 24%
Change: McCain +0
Demographics: Hispanic 20%, Asian 27%, 46% White
Communities of Interest: South San Francisco (the industrial city,) Redwood City, Half Moon Bay
Status: Safe Democratic
The district picks up the San Mateo County coastline and part of Redwood City but besides that, the district remains the same.
13th District Pete Stark (D) Fremont
Obama 183,890 74%, McCain 58,035 24%
Change: McCain +0
Demographics: 7% African American, 25% Hispanic, 23% Asian, 40% White
Communities of Interest: Hayward, Fremont, Santa Clara
Status: Safe Democratic
Stark's district loses some of Fremont to the plurality Asian 15th and gains minority majority areas in Sunnyvalle and Santa Clara. These changes should affect the district much.
14th District Anna Eshoo (D) Atherton
Obama 220,962 70% McCain 90,352 28%
Change: McCain +6
Demographics: 13% Hispanic, 17% Asian, 64% White
Communities of Interest: Mountain View, Los Altos, San Jose
Status: Safe Democratic
The district loses all of Santa Cruz County and goes into mostly white areas formerly in the 15th district. Although the changes rise the McCain percentage a bit, Eshoo is still very safe and has her home in the district.
15th District Mike Honda (D) San Jose
Obama: 170,000 70% McCain 69,345 28%
Change: Obama +4
Demographics: 18% Hispanic, 43% Asian, 31% White
Communities of Interest: Fremont, San Jose, Cupertino
Status: Safe Democratic
This is one of the two Asian plurality districts I created on the map. I added Union City and Asian parts of Fremont while removing white neighborhoods in western San Jose. Honda should be safe here.

16th District Zoe Lofgren (D) San Jose
Obama 130,902 67% McCain 60,558 32%Change: McCain +6
Demographics: 13% Asian, 50% Hispanic, 29% White
Communities of Interest: Fresno, Watsonville, San Jose
Status: Safe Democratic
I think Zoe is a great representative but I had to create more districts for Hispanic representatives. This district keeps Hispanic areas in San Jose and picks up Hispanic areas in San Benito, Santa Cruz and Fresno Counties. Although 50% Hispanic is barely a majority, the number should be 54% about now and Hispanics outside her district are not used to voting for her in the primary.
17th District Sam Farr (D) Carmel
Obama 216,197 65% McCain 109,291 33%
Change: McCain +14
Demographics: 17% Hispanic, 6% Asian, 71% White
Communities of Interest: San Carlos, Santa Cruz, Monterey
Status: Safe Democratic
The district gets whiter and safer for Farr. It is interesting though having a district represent Peninsula and San Luis Obisbo communities. I removed Hispanic parts of Monterey County and San Benito County while adding Republican eastern San Luis Obisbo County as well as some white San Mateo County neighborhoods. Farr is still very safe.
18th District Dennis Cardoza (D) Atwater
Obama 96,786 61% McCain 59,722 37%
Change: Obama +4
Demographics: 6% African American, 46% Hispanic, 8% Asian, 36% White
Communities of Interest: Stockton, Modesto, Merced
Status: Safe Democratic
Cardoza loses whiter parts of Merced County and picks up more Hispanic neighborhoods in Madera County, making the district a tad more Democratic and Hispanic.
19th District George Radanovich (R) Mariposa
Obama 115,407 41% McCain 157,413 57%
Change: McCain +10
Communities of Interest: Clovis, Madera, Merced
Status: Safe Republican
Radanovich’s district was safe already but now it is even safer with the removal of Democratic parts of Fresno and the inclusion of Republican parts of Merced. Also, Yosemite National Park which is Democratic was removed.
20th District Jim Costa (D) Fresno
Obama 91,480 59% McCain 61,190 40%
Change: McCain +2
Demographics: 6% African American, 55% Hispanic, 7% Asian, 27% White
Communities of Interest: Fresno, Salinas, Shafter
Status: Safe Democratic
Although Costa’s district picks up Democratic and Hispanic areas in Monterey County, the district grows more Republican as it extends into Republican white areas around Fresno formerly in the 19th district. Costa’s district is still Hispanic and Democratic.
21st District Devin Nunes (R) Tulare
Obama 70,892 53% McCain 61,228 46%
Change: Obama +22
Demographics: 63% Hispanic, 25% White
Communities of Interest: Bakersfield, Visalia, Delano
Status: Likely Democratic
This is the new Hispanic majority district in the Central Valley. Nunes’s district now takes in Hispanic parts of Fresno County and Hispanic parts of Tulare County. The district also takes in Hispanic parts of Bakersfield. This district is probably too Hispanic for Nunes so he will probably not run here. The Democrats should find a Hispanic candidate who will help increase the Obama percentage by turning out the Hispanics and having them vote more Democratic. Even if Nunes runs, he should lose.
22nd District Kevin McCarthy (R) Bakersfield
Obama 96,063 37% McCain 161,271 61%
Change: McCain +2
Demographics: 22% Hispanic, 67% White
Communities of Interest: Bakersfield, Visalia, California City
Status: Safe Republican
McCarthy’s district changes as it loses San Luis Obisbo County and picks up Republican parts of Tulare and Ventura Counties. It even goes into Simi Valley which is close to the San Fernando Valley. Nunes might run in this district because the 21st is too Democratic for him. McCarthy should win because most of his current district is in the new 22nd district.
23rd District Lois Capps (D) Santa Barbara
Obama 187,384 61% McCain 115,227 37%
Change: McCain +10
Demographics: 31% Hispanic, 60% White
Communities of Interest: San Luis Obisbo, Santa Barbara, Ventura
Status: Safe Democratic
Capps’s district gets less Democratic. I removed heavily Hispanic Oxnard and added the Republican interior of Santa Barbara County. I also added Ventura and Ojai which lean Democratic. The only place where Capps’s district is a line along the coast is in San Luis Obisbo County. Although her district becomes similar to the competitive 1990’s lines, she is entrenched enough and the areas trended Democratic enough to protect her.

24th District Elton Gallegy (R) Simi Valley
Obama 149,125 59% McCain 100,007 40%
Change: Obama +16
Demographics: 39% Hispanic, 9% Asian, 45% White
Communities of Interest: Oxnard, Moorpark, San Fernando Valley
Status: Likely Democratic
Gallegy’s district gets much more Democratic and the Hispanic population rises from 24% to 39% with the inclusion of Oxnard, Hispanic areas in the San Fernando Valley and the loss of interior Santa Barbara County. Although Gallegy is a popular incumbent, the 24th district is too Democratic. He is also not entrenched in Oxnard and the San Fernando Valley. This should get him to retire which he has been considering. This is a good district for Brad Sherman to run in because his district is combined with the more entrenched Howard Berman. The 24th also contains part of Sherman's current district. If Sherman ran, he would definitely win here.
25th District Buck McKeon (R) Santa Clarita
Obama 135,401 55% McCain 106,766 43%
Change: Obama +10
Demographics: 9% African American, 31% Hispanic, 51% White
Communities of Interest: Lancaster, Victorville, South Lake Tahoe
Status: Toss Up/Tilt Democratic
Although Buck McKeon does not live in the district, it belongs to him because it contains most of his old territory. It will be harder for him to win because I added the Democratic Lake Tahoe area, moved Republican Santa Clarita and added a few Hispanic neighborhoods in the San Fernando Valley. Although McKeon is popular, the district is trending Democratic, especially around Lancaster and Palmdale. If the Democrats find a great candidate, they should be able to kick off McKeon.
26th District Vacant (D)
Obama 128,868 63% McCain 71,638 36%
Change: N/A
Demographics: 5% African American, 56% Hispanic, 8% Asian, 28% White
Communities of Interest: Upland, Glendora, San Fernando
Status: Safe Democratic
This new district is also a new Hispanic majority district. It looks like David Dreier’s (R) current district but this district picks up heavily Hispanic areas instead of areas that lean Republican. It does contain Glendora which is Republican though. Still, a Democratic should have no trouble winning here and a 56% Hispanic population (and increasing) should be enough to elect a Hispanic representative.

27th District Howard Berman (D) vs. Brad Sherman (D) Green
Obama 204,550 65% McCain 104,583 33%
Change: McCain +22
Demographics: 20% Hispanic, 8% Asian, 64% White
Communities of Interest: Santa Clarita, San Fernando Valley, Burbank
Status: Safe Democratic
Berman’s district gets less Democratic with the inclusion of Santa Clarita and more white but remains heavily Democratic. Sherman has less territory here than Berman so if I were Sherman, I would run in the 24th District which has part of Sherman’s current territory.
28th District Adam Schiff (D) Burbank (originally the 29th)
Obama 179,592 68% McCain 80,069 30%
Change: McCain +0
Demographics: 6% African American, 32% Hispanic, 13% Asian, 43% White
Communities of Interest: Pasadena, Glendale, La Canada Flitridge
Status: Safe Democratic
Schiff’s district remains pretty similar with a high enough white population to keep him in office and Democratic.
29th District Henry Waxman (D) Los Angeles (originally the 30th)
Obama 245,543 68% McCain 111,756 30%
Change: McCain +4
Demographics: 10% Hispanic, 9% Asian, 76% White
Communities of Interest: Thousand Oaks, Beverly Hills, Santa Monica
Status: Safe Democratic
Waxman’s district picks up marginal Thousand Oaks and loses a few Democratic areas in the San Fernando Valley. These minor changes do not affect the district’s strong Democratic lean.
30th District Xavier Beccara (D) Eagle Rock (originally the 31st)
Obama 141,239 81% McCain 29,245 17%
Change: Obama +2
Demographics: 5% African American, 61% Hispanic, 15% Asian, 16% White
Communities of Interest: Monterey Park, Los Angeles
Status: Safe Democratic
Beccara’s district was formerly 70% Hispanic but now has less Hispanics with the inclusion of white areas formerly in Watson’s district. Beccara’s district is still heavily Hispanic and safely Democratic though.
31st District Judy Chu (D) Monterey Park (originally the 32nd)
Obama 132,559 62% McCain 78,365 36%
Change: McCain +12
Demographics: 39% Hispanic, 38% Asian, 18% White
Communities of Interest: El Monte, Temple City, Walnut
Status: Safe Democratic
I know that Asians do not vote as one bloc but I think if given the choice, they will support an Asian candidate over a Hispanic one. Chu’s district gets more Asian with a small line to Walnut and Diamond Bar and the exclusion of Baldwin Park and the vicinity. Her district gets more Republican but she is still safe.
32nd District Diane Watson (D) Los Angeles (originally the 33rd) Orange color
Obama 149,611 83% McCain 28,305 16%
Change: McCain +8
Demographics: 20% African American, 53% Hispanic, 11% Asian, 12% White
Communities of Interest: Los Angeles, Culver City, Huntington Park
Status: Safe Democratic
Watson is retiring and the Hispanic population is getting too high in Los Angeles to keep three districts with African American representatives. I removed white areas in the northern part of the district and added Hispanic areas on the east and west sides of the original 35th district while taking out some African American areas in the district’s center. The Hispanic population will keep growing so the district should elect a Hispanic.
33rd District Lucille Roybal Allard (D) Los Angeles (formerly the 34th)
Obama 123,083 66% McCain 59,211 32%
Change: McCain +18
Demographics: 74% Hispanic, 18% White
Communities of Interest: Huntington Park, Downey, La Habra
Status: Safe Democratic
Allard’s district gets more Republican with losing some Hispanic areas in Los Angeles and adding whiter Whitter and La Habra. Although La Habra is Republican, Allard’s district is still safe and Democratic.
34th District Maxine Waters (D)
Obama 202,877 88% McCain 23,877 10%
Change: Obama +10
Demographics: 43% African American, 41% Hispanic, 7% Asian, 6% White
Communities of Interest: Los Angeles, Inglewood, Gardena
Status: Safe Democratic
Waters’s district gets safer as the African American population increases from 34% to 43%. Also, something interesting is you can see how high African American turnout really was by looking at the precincts. There were 930 votes in a 92% African American precinct with 1,380 people.
35th District Jane Harman (D) Venice (formerly the 36th) Purple
Obama 192,875 62% McCain 113,650 36%
Change: McCain +4
Demographics: 26% Hispanic, 15% Asian, 51% White
Communities of Interest: Torrance, Redondo Beach, Manhattan Beach
Status: Safe Democratic
Harman’s district gets more Republican with the addition of Rancho Palos Verdes which leans Republican. Communities in the district’s northern part like Venice keep Harman safe though.
36th District Laura Richardson (D) Long Beach (formerly the 37th)
Obama 162,948 71% McCain 61,850 28%
Change: McCain +18
Demographics: 22% African American, 40% Hispanic, 11% Asian, 23% White
Communities of Interest: Carson, Compton, Seal Beach
Status: Safe Democratic
Adding Orange County communities that lean Republican such as Seal Beach and Los Alamitos make this district more Republican. They also reduce the Hispanic population by a few points though. Richardson should have no problems from Republicans in a district where McCain won 28% of the vote though.
37th District Grace Napolitiano (D) Norwalk (formerly the 38th district)
Obama 131,462 67% McCain 59,629 31%
Change: McCain +8
Demographics: 66% Hispanic, 15% Asian, 14% White
Communities of Interest: Baldwin Park, Chino Hills, Pico Rivera
Status: Safe Democratic
Grace Napolitiano (D) has her home in the 38th district but she should run here because this district has most of her current district. The district becomes a bit gerrymandered by having the 32nd cut into the middle of it. Also, her district gets Republican Chino Hills. It is still safely Democratic though.

38th District Linda Sanchez (D) Lakewood (formerly the 39th)
Obama 135,584 60% McCain 87,210 38%
Change: McCain +12
Demographics: 6% African American, 54% Hispanic, 9% Asian, 29% White
Communities of Interest: Lynwood, Bellflower, Fullerton
Status: Safe Democratic
Napolitiano should run in the 37th district so Sanchez should be safe from a primary challenge. Also, the district should be Hispanic and Democratic enough to protect her from Republicans. Her district does get weaker with the addition of Republican parts of Fullerton though.
39th District Ed Royce (R) Fullerton (formerly the 40th district)
Obama 113,574 54% McCain 93,975 44%
Change: Obama +14
Demographics: 40% Hispanic, 18% Asian, 35% White
Communities of Interest: Norwalk, Cypress, Anaheim
Status: Toss Up/Tilt Democratic
Royce’s district gets much more Democratic with the addition of Democratic parts of Anaheim, Norwalk and he loses Republican parts of Fullerton to the 42nd. Royce is pretty entrenched in his district but not in the Norwalk area so Democrats have a strong shot at replacing him. Also, it would not be easy for a Republican to win in a 35% White district (and decreasing.)
40th District David Dreier (R) San Dimas (formerly the 26th)
Obama 127,168 58% McCain 89,498 40%
Change: Obama +14
Demographics: 7% African American, 46% Hispanic, 7% Asian, 37% White
Communities of Interest: Pomona, Upland, Rancho Cucamonga
Status: Likely Democratic
Dreier is a pretty popular incumbent but even he will have trouble in a 58% Obama district with unfamiliar territory such as Azusa, Ontario and Pomona. He also loses the most Republican parts of his current district. Dreier will probably not run and a Democrat will win easily. If Dreier runs, he will probably not be strong enough to compete with the new Democratic areas. I hope a Hispanic politician wins this seat and although Hispanics do not make a large share of voters, there should be more in the Democratic primary.
 41st District Jerry Lewis (R) Redlands
Obama 104,391 41% McCain 147,051 57%
Change: McCain +6
Demographics: 20% Hispanic, 69% White
Communities of Interest: Hesperia, Beaumont, Yucaipa
Status: Safe Republican
Lewis was extremely safe before and he gets even safer. Enough said.
42nd District Gary Miller (R) Diamond Bar
Obama 131,169 40% McCain 189,640 58%
Change: McCain +10
Demographics: 15% Hispanic, 8% Asian, 71% White
Communities of Interest: Yorba Linda, Murrieta, Rancho Santa Margarita
Status: Safe Republican
Miller loses his home but he does not have to live in this district to run. His district gets more Republican by picking up the Lake Forest area formerly in the 44th and Murrieta formerly in the 45th. He has no worries.
43rd District Joe Baca (D) Rialto
Obama 107,522 66% McCain 52,753 32%
Change: McCain +4
Demographics: 14% African American, 51% Hispanic, 5% Asian, 27% White
Communities of Interest: San Bernadino, Fontana, Ontario
Status: Safe Democratic
Baca’s district gets less Hispanic but the Hispanic population is growing quickly and he is entrenched enough to survive. He should have no problems from Republicans though.
44th District Ken Calvert (R) Corona
Obama 92,733 56% McCain 70,846 43%
Change: Obama +12
Demographics: 7% African American, 43% Hispanic, 5% Asian, 41% White
Communities of Interest: Riverside, Norco, Colton
Status: Likely Democratic
In 2008, Calvert barely won reelection but he lost Riverside County. Now with the Republican parts of Orange County removed, Calvert is in trouble. I also removed Republican areas in Riverside County too and the addition of heavily Hispanic Colton does not help Calvert either. Since Calvert was already weak, it should not be too difficult to find a challenger, get the DCCC interested and kick out Calvert.
45th District Mary Bono (R) Palm Springs
Obama 113,612 57% McCain 82,064 42%
Change: Obama +10
Demographics: 10% African American, 36% Hispanic, 46% White
Communities of Interest: Moreno Valley, Perris, San Jacinto
Status: Lean Democratic
Bono is a popular moderate incumbent but she will probably lose here. I added Democratic Perris and Lake Elsinore while removing Hemet. Also, the district has fast growing African American and Hispanic populations so if a Democrat is not reelected in 2012, a Democrat certainly will be soon.
46th District Dana Rohrabacher (R) Huntington Beach
Obama 163,591 55% McCain 127,405 43%
Change: Obama +10
Demographics: 23% Hispanic, 13% Asian, 58% White
Communities of Interest: Long Beach, Irvine, Costa Mesa
Status: Lean Democratic
Rohrabacher keeps most of his old district where he is entrenched. Still, the addition of Irvine and Democratic Long Beach areas should be enough to unseat him with a good candidate.
47th District Loretta Sanchez (D) Garden Grove
Obama 89,040 55% McCain 69,075 43%
Change: McCain +10
Demographics: 55% Hispanic, 19% Asian, 21% White
Communities of Interest: Santa Ana, Anaheim, Tustin
Status: Likely Democratic
Sanchez’s district gets less Democratic and Hispanic but Sanchez is entrenched and should win Hispanic by large margins.
48th District John Campbell (R) Irvine Peach
Obama 135,283 48% McCain 144,225 51%
Change: McCain +3
Demographics: 21% Hispanic, 7% Asian, 65% White
Communities of Interest: Vista, Oceanside, Lake Forest
Status: Likely Republican
Yes, I know Campbell is a birther but I realized that if I tried to get rid of him, I would make other seats safer for Republicans that I wanted Democratic. Campbell’s district is mostly shifted out of the Irvine area into more conservative Vista and Oceanside. By the end of the decade, Campbell should be vulnerable but for now, he is unfortunately safe.
49th District Darrell Issa (R) Vista
Obama 113,663 39% McCain 175,745 59%
Change: McCain +12
Demographics: 18% Hispanic, 73% White
Communities of Interest: Hemet, Temecula, Poway
Status: Safe Republican
Issa’s home is not in the district but he should not mind. His district gets more Republican with the loss of Perris and Lake Elsinore.

50th District Brian Bilbray (R) Carlsbad
Obama 187,575 56% McCain 144,396 42%
Change: Obama +10
Demographics: 19% Hispanic, 6% Asian, 70% White
Communities of Interest: Carlsbad, Escondido, San Diego
Status: Likely Democratic
Bilbray has faced close races in his currently marginal district but the addition of liberal parts of San Diego near the coast make the district more Democratic. He also loses more conservative areas in the east to the 53rd district. These changes should be enough to elect a Democrat.
51st District Bob Filner (D) San Diego
Obama 112,770 63% McCain 64,790 36%
Change: McCain +0
Demographics: 7% African American, 62% Hispanic, 10% Asian, 19% White
Communities of Interest: Indio, El Centro, Chula Vista
Status: Safe Democratic
I think Bob Filner is fine but I wanted another Hispanic congressman so I increased the Hispanic population from 53% to 62%. Although Filner has not faced many challenges recently, the change in population should attract a strong Hispanic candidate.
52nd District Duncan Hunter Jr. (R) Lakeside
Obama 135,237 56% McCain 101,445 42%
Change: Obama +22
Demographics: 7% African American, 29% Hispanic, 9% Asian, 51% White
Communities of Interest: La Mesa, El Cajon, Chula Vista
Status: Likely Democratic
This district undergoes one of the largest partisan changes under my plan. Duncan Hunter Jr. is new to this district. The addition of Chula Vista and Democratic parts of San Diego unfamiliar with him (and his father) will not help him. The changes should make the district Democratic enough to elect a Democrat.
53rd District Susan Davis (D) San Diego
Obama 167,156 60% McCain 107,595 38%
Change: McCain +16
Demographics: 7% African American, 24% Hispanic, 14% Asian, 51% White
Communities of Interest: Cornado, Imperial Beach, San Diego
Status: Safe Democratic
Davis’s district goes inland and therefore gets more Republican but coastal areas keep this district Democratic.
Change: McCain +10
Communities of Interest: Clovis, Madera, Merced
Status: Safe Republican
Radanovich’s district was safe already but now it is even safer with the removal of Democratic parts of Fresno and the inclusion of Republican parts of Merced. Also, Yosemite National Park which is Democratic was removed.
20th District Jim Costa (D) Fresno
Obama 91,480 59% McCain 61,190 40%
Change: McCain +2
Demographics: 6% African American, 55% Hispanic, 7% Asian, 27% White
Communities of Interest: Fresno, Salinas, Shafter
Status: Safe Democratic
Although Costa’s district picks up Democratic and Hispanic areas in Monterey County, the district grows more Republican as it extends into Republican white areas around Fresno formerly in the 19th district. Costa’s district is still Hispanic and Democratic.
21st District Devin Nunes (R) Tulare
Obama 70,892 53% McCain 61,228 46%
Change: Obama +22
Demographics: 63% Hispanic, 25% White
Communities of Interest: Bakersfield, Visalia, Delano
Status: Likely Democratic
This is the new Hispanic majority district in the Central Valley. Nunes’s district now takes in Hispanic parts of Fresno County and Hispanic parts of Tulare County. The district also takes in Hispanic parts of Bakersfield. This district is probably too Hispanic for Nunes so he will probably not run here. The Democrats should find a Hispanic candidate who will help increase the Obama percentage by turning out the Hispanics and having them vote more Democratic. Even if Nunes runs, he should lose.
22nd District Kevin McCarthy (R) Bakersfield
Obama 96,063 37% McCain 161,271 61%
Change: McCain +2
Demographics: 22% Hispanic, 67% White
Communities of Interest: Bakersfield, Visalia, California City
Status: Safe Republican
McCarthy’s district changes as it loses San Luis Obisbo County and picks up Republican parts of Tulare and Ventura Counties. It even goes into Simi Valley which is close to the San Fernando Valley. Nunes might run in this district because the 21st is too Democratic for him. McCarthy should win because most of his current district is in the new 22nd district.
23rd District Lois Capps (D) Santa Barbara
Obama 187,384 61% McCain 115,227 37%
Change: McCain +10
Demographics: 31% Hispanic, 60% White
Communities of Interest: San Luis Obisbo, Santa Barbara, Ventura
Status: Safe Democratic
Capps’s district gets less Democratic. I removed heavily Hispanic Oxnard and added the Republican interior of Santa Barbara County. I also added Ventura and Ojai which lean Democratic. The only place where Capps’s district is a line along the coast is in San Luis Obisbo County. Although her district becomes similar to the competitive 1990’s lines, she is entrenched enough and the areas trended Democratic enough to protect her.

24th District Elton Gallegy (R) Simi Valley
Obama 149,125 59% McCain 100,007 40%
Change: Obama +16
Demographics: 39% Hispanic, 9% Asian, 45% White
Communities of Interest: Oxnard, Moorpark, San Fernando Valley
Status: Likely Democratic
Gallegy’s district gets much more Democratic and the Hispanic population rises from 24% to 39% with the inclusion of Oxnard, Hispanic areas in the San Fernando Valley and the loss of interior Santa Barbara County. Although Gallegy is a popular incumbent, the 24th district is too Democratic. He is also not entrenched in Oxnard and the San Fernando Valley. This should get him to retire which he has been considering. This is a good district for Brad Sherman to run in because his district is combined with the more entrenched Howard Berman. The 24th also contains part of Sherman's current district. If Sherman ran, he would definitely win here.
25th District Buck McKeon (R) Santa Clarita
Obama 135,401 55% McCain 106,766 43%
Change: Obama +10
Demographics: 9% African American, 31% Hispanic, 51% White
Communities of Interest: Lancaster, Victorville, South Lake Tahoe
Status: Toss Up/Tilt Democratic
Although Buck McKeon does not live in the district, it belongs to him because it contains most of his old territory. It will be harder for him to win because I added the Democratic Lake Tahoe area, moved Republican Santa Clarita and added a few Hispanic neighborhoods in the San Fernando Valley. Although McKeon is popular, the district is trending Democratic, especially around Lancaster and Palmdale. If the Democrats find a great candidate, they should be able to kick off McKeon.
26th District Vacant (D)
Obama 128,868 63% McCain 71,638 36%
Change: N/A
Demographics: 5% African American, 56% Hispanic, 8% Asian, 28% White
Communities of Interest: Upland, Glendora, San Fernando
Status: Safe Democratic
This new district is also a new Hispanic majority district. It looks like David Dreier’s (R) current district but this district picks up heavily Hispanic areas instead of areas that lean Republican. It does contain Glendora which is Republican though. Still, a Democratic should have no trouble winning here and a 56% Hispanic population (and increasing) should be enough to elect a Hispanic representative.

27th District Howard Berman (D) vs. Brad Sherman (D) Green
Obama 204,550 65% McCain 104,583 33%
Change: McCain +22
Demographics: 20% Hispanic, 8% Asian, 64% White
Communities of Interest: Santa Clarita, San Fernando Valley, Burbank
Status: Safe Democratic
Berman’s district gets less Democratic with the inclusion of Santa Clarita and more white but remains heavily Democratic. Sherman has less territory here than Berman so if I were Sherman, I would run in the 24th District which has part of Sherman’s current territory.
28th District Adam Schiff (D) Burbank (originally the 29th)
Obama 179,592 68% McCain 80,069 30%
Change: McCain +0
Demographics: 6% African American, 32% Hispanic, 13% Asian, 43% White
Communities of Interest: Pasadena, Glendale, La Canada Flitridge
Status: Safe Democratic
Schiff’s district remains pretty similar with a high enough white population to keep him in office and Democratic.
29th District Henry Waxman (D) Los Angeles (originally the 30th)
Obama 245,543 68% McCain 111,756 30%
Change: McCain +4
Demographics: 10% Hispanic, 9% Asian, 76% White
Communities of Interest: Thousand Oaks, Beverly Hills, Santa Monica
Status: Safe Democratic
Waxman’s district picks up marginal Thousand Oaks and loses a few Democratic areas in the San Fernando Valley. These minor changes do not affect the district’s strong Democratic lean.
30th District Xavier Beccara (D) Eagle Rock (originally the 31st)
Obama 141,239 81% McCain 29,245 17%
Change: Obama +2
Demographics: 5% African American, 61% Hispanic, 15% Asian, 16% White
Communities of Interest: Monterey Park, Los Angeles
Status: Safe Democratic
Beccara’s district was formerly 70% Hispanic but now has less Hispanics with the inclusion of white areas formerly in Watson’s district. Beccara’s district is still heavily Hispanic and safely Democratic though.
31st District Judy Chu (D) Monterey Park (originally the 32nd)
Obama 132,559 62% McCain 78,365 36%
Change: McCain +12
Demographics: 39% Hispanic, 38% Asian, 18% White
Communities of Interest: El Monte, Temple City, Walnut
Status: Safe Democratic
I know that Asians do not vote as one bloc but I think if given the choice, they will support an Asian candidate over a Hispanic one. Chu’s district gets more Asian with a small line to Walnut and Diamond Bar and the exclusion of Baldwin Park and the vicinity. Her district gets more Republican but she is still safe.
32nd District Diane Watson (D) Los Angeles (originally the 33rd) Orange color
Obama 149,611 83% McCain 28,305 16%
Change: McCain +8
Demographics: 20% African American, 53% Hispanic, 11% Asian, 12% White
Communities of Interest: Los Angeles, Culver City, Huntington Park
Status: Safe Democratic
Watson is retiring and the Hispanic population is getting too high in Los Angeles to keep three districts with African American representatives. I removed white areas in the northern part of the district and added Hispanic areas on the east and west sides of the original 35th district while taking out some African American areas in the district’s center. The Hispanic population will keep growing so the district should elect a Hispanic.
33rd District Lucille Roybal Allard (D) Los Angeles (formerly the 34th)
Obama 123,083 66% McCain 59,211 32%
Change: McCain +18
Demographics: 74% Hispanic, 18% White
Communities of Interest: Huntington Park, Downey, La Habra
Status: Safe Democratic
Allard’s district gets more Republican with losing some Hispanic areas in Los Angeles and adding whiter Whitter and La Habra. Although La Habra is Republican, Allard’s district is still safe and Democratic.
34th District Maxine Waters (D)
Obama 202,877 88% McCain 23,877 10%
Change: Obama +10
Demographics: 43% African American, 41% Hispanic, 7% Asian, 6% White
Communities of Interest: Los Angeles, Inglewood, Gardena
Status: Safe Democratic
Waters’s district gets safer as the African American population increases from 34% to 43%. Also, something interesting is you can see how high African American turnout really was by looking at the precincts. There were 930 votes in a 92% African American precinct with 1,380 people.
35th District Jane Harman (D) Venice (formerly the 36th) Purple
Obama 192,875 62% McCain 113,650 36%
Change: McCain +4
Demographics: 26% Hispanic, 15% Asian, 51% White
Communities of Interest: Torrance, Redondo Beach, Manhattan Beach
Status: Safe Democratic
Harman’s district gets more Republican with the addition of Rancho Palos Verdes which leans Republican. Communities in the district’s northern part like Venice keep Harman safe though.
36th District Laura Richardson (D) Long Beach (formerly the 37th)
Obama 162,948 71% McCain 61,850 28%
Change: McCain +18
Demographics: 22% African American, 40% Hispanic, 11% Asian, 23% White
Communities of Interest: Carson, Compton, Seal Beach
Status: Safe Democratic
Adding Orange County communities that lean Republican such as Seal Beach and Los Alamitos make this district more Republican. They also reduce the Hispanic population by a few points though. Richardson should have no problems from Republicans in a district where McCain won 28% of the vote though.
37th District Grace Napolitiano (D) Norwalk (formerly the 38th district)
Obama 131,462 67% McCain 59,629 31%
Change: McCain +8
Demographics: 66% Hispanic, 15% Asian, 14% White
Communities of Interest: Baldwin Park, Chino Hills, Pico Rivera
Status: Safe Democratic
Grace Napolitiano (D) has her home in the 38th district but she should run here because this district has most of her current district. The district becomes a bit gerrymandered by having the 32nd cut into the middle of it. Also, her district gets Republican Chino Hills. It is still safely Democratic though.

38th District Linda Sanchez (D) Lakewood (formerly the 39th)
Obama 135,584 60% McCain 87,210 38%
Change: McCain +12
Demographics: 6% African American, 54% Hispanic, 9% Asian, 29% White
Communities of Interest: Lynwood, Bellflower, Fullerton
Status: Safe Democratic
Napolitiano should run in the 37th district so Sanchez should be safe from a primary challenge. Also, the district should be Hispanic and Democratic enough to protect her from Republicans. Her district does get weaker with the addition of Republican parts of Fullerton though.
39th District Ed Royce (R) Fullerton (formerly the 40th district)
Obama 113,574 54% McCain 93,975 44%
Change: Obama +14
Demographics: 40% Hispanic, 18% Asian, 35% White
Communities of Interest: Norwalk, Cypress, Anaheim
Status: Toss Up/Tilt Democratic
Royce’s district gets much more Democratic with the addition of Democratic parts of Anaheim, Norwalk and he loses Republican parts of Fullerton to the 42nd. Royce is pretty entrenched in his district but not in the Norwalk area so Democrats have a strong shot at replacing him. Also, it would not be easy for a Republican to win in a 35% White district (and decreasing.)
40th District David Dreier (R) San Dimas (formerly the 26th)
Obama 127,168 58% McCain 89,498 40%
Change: Obama +14
Demographics: 7% African American, 46% Hispanic, 7% Asian, 37% White
Communities of Interest: Pomona, Upland, Rancho Cucamonga
Status: Likely Democratic
Dreier is a pretty popular incumbent but even he will have trouble in a 58% Obama district with unfamiliar territory such as Azusa, Ontario and Pomona. He also loses the most Republican parts of his current district. Dreier will probably not run and a Democrat will win easily. If Dreier runs, he will probably not be strong enough to compete with the new Democratic areas. I hope a Hispanic politician wins this seat and although Hispanics do not make a large share of voters, there should be more in the Democratic primary.

Obama 104,391 41% McCain 147,051 57%
Change: McCain +6
Demographics: 20% Hispanic, 69% White
Communities of Interest: Hesperia, Beaumont, Yucaipa
Status: Safe Republican
Lewis was extremely safe before and he gets even safer. Enough said.
42nd District Gary Miller (R) Diamond Bar
Obama 131,169 40% McCain 189,640 58%
Change: McCain +10
Demographics: 15% Hispanic, 8% Asian, 71% White
Communities of Interest: Yorba Linda, Murrieta, Rancho Santa Margarita
Status: Safe Republican
Miller loses his home but he does not have to live in this district to run. His district gets more Republican by picking up the Lake Forest area formerly in the 44th and Murrieta formerly in the 45th. He has no worries.
43rd District Joe Baca (D) Rialto
Obama 107,522 66% McCain 52,753 32%
Change: McCain +4
Demographics: 14% African American, 51% Hispanic, 5% Asian, 27% White
Communities of Interest: San Bernadino, Fontana, Ontario
Status: Safe Democratic
Baca’s district gets less Hispanic but the Hispanic population is growing quickly and he is entrenched enough to survive. He should have no problems from Republicans though.
44th District Ken Calvert (R) Corona
Obama 92,733 56% McCain 70,846 43%
Change: Obama +12
Demographics: 7% African American, 43% Hispanic, 5% Asian, 41% White
Communities of Interest: Riverside, Norco, Colton
Status: Likely Democratic
In 2008, Calvert barely won reelection but he lost Riverside County. Now with the Republican parts of Orange County removed, Calvert is in trouble. I also removed Republican areas in Riverside County too and the addition of heavily Hispanic Colton does not help Calvert either. Since Calvert was already weak, it should not be too difficult to find a challenger, get the DCCC interested and kick out Calvert.
45th District Mary Bono (R) Palm Springs
Obama 113,612 57% McCain 82,064 42%
Change: Obama +10
Demographics: 10% African American, 36% Hispanic, 46% White
Communities of Interest: Moreno Valley, Perris, San Jacinto
Status: Lean Democratic
Bono is a popular moderate incumbent but she will probably lose here. I added Democratic Perris and Lake Elsinore while removing Hemet. Also, the district has fast growing African American and Hispanic populations so if a Democrat is not reelected in 2012, a Democrat certainly will be soon.
46th District Dana Rohrabacher (R) Huntington Beach
Obama 163,591 55% McCain 127,405 43%
Change: Obama +10
Demographics: 23% Hispanic, 13% Asian, 58% White
Communities of Interest: Long Beach, Irvine, Costa Mesa
Status: Lean Democratic
Rohrabacher keeps most of his old district where he is entrenched. Still, the addition of Irvine and Democratic Long Beach areas should be enough to unseat him with a good candidate.
47th District Loretta Sanchez (D) Garden Grove
Obama 89,040 55% McCain 69,075 43%
Change: McCain +10
Demographics: 55% Hispanic, 19% Asian, 21% White
Communities of Interest: Santa Ana, Anaheim, Tustin
Status: Likely Democratic
Sanchez’s district gets less Democratic and Hispanic but Sanchez is entrenched and should win Hispanic by large margins.
48th District John Campbell (R) Irvine Peach
Obama 135,283 48% McCain 144,225 51%
Change: McCain +3
Demographics: 21% Hispanic, 7% Asian, 65% White
Communities of Interest: Vista, Oceanside, Lake Forest
Status: Likely Republican
Yes, I know Campbell is a birther but I realized that if I tried to get rid of him, I would make other seats safer for Republicans that I wanted Democratic. Campbell’s district is mostly shifted out of the Irvine area into more conservative Vista and Oceanside. By the end of the decade, Campbell should be vulnerable but for now, he is unfortunately safe.
49th District Darrell Issa (R) Vista
Obama 113,663 39% McCain 175,745 59%
Change: McCain +12
Demographics: 18% Hispanic, 73% White
Communities of Interest: Hemet, Temecula, Poway
Status: Safe Republican
Issa’s home is not in the district but he should not mind. His district gets more Republican with the loss of Perris and Lake Elsinore.

50th District Brian Bilbray (R) Carlsbad
Obama 187,575 56% McCain 144,396 42%
Change: Obama +10
Demographics: 19% Hispanic, 6% Asian, 70% White
Communities of Interest: Carlsbad, Escondido, San Diego
Status: Likely Democratic
Bilbray has faced close races in his currently marginal district but the addition of liberal parts of San Diego near the coast make the district more Democratic. He also loses more conservative areas in the east to the 53rd district. These changes should be enough to elect a Democrat.
51st District Bob Filner (D) San Diego
Obama 112,770 63% McCain 64,790 36%
Change: McCain +0
Demographics: 7% African American, 62% Hispanic, 10% Asian, 19% White
Communities of Interest: Indio, El Centro, Chula Vista
Status: Safe Democratic
I think Bob Filner is fine but I wanted another Hispanic congressman so I increased the Hispanic population from 53% to 62%. Although Filner has not faced many challenges recently, the change in population should attract a strong Hispanic candidate.
52nd District Duncan Hunter Jr. (R) Lakeside
Obama 135,237 56% McCain 101,445 42%
Change: Obama +22
Demographics: 7% African American, 29% Hispanic, 9% Asian, 51% White
Communities of Interest: La Mesa, El Cajon, Chula Vista
Status: Likely Democratic
This district undergoes one of the largest partisan changes under my plan. Duncan Hunter Jr. is new to this district. The addition of Chula Vista and Democratic parts of San Diego unfamiliar with him (and his father) will not help him. The changes should make the district Democratic enough to elect a Democrat.
53rd District Susan Davis (D) San Diego
Obama 167,156 60% McCain 107,595 38%
Change: McCain +16
Demographics: 7% African American, 24% Hispanic, 14% Asian, 51% White
Communities of Interest: Cornado, Imperial Beach, San Diego
Status: Safe Democratic
Davis’s district goes inland and therefore gets more Republican but coastal areas keep this district Democratic.
Friday, May 7, 2010
Baselines for Florida's Gubernatorial Race
Charlie Crist (R), the current Governor of Florida is not running for reelection this year because he is running for Senate as an Independent (which is another story.) He leaves the Governorship open so Alex Sink (D) and Bill McCollum (R) are running for it. Sink is the current CFO for Florida and she won with 53% of the vote in 2006. McCollum is the Attorney General of Florida (who supports repealing the healthcare bill which prevents companies from denying people with preexisting conditions) and he was elected with 52% of the vote in 2006. The campaign has not kicked into high gear but a Rasmussen poll showed McCollum leading by 7. This poll on April 16th is the most recent poll on the race and Rasmussen usually leans to the right. For these reasons, it is hard to tell if McCollum still has a lead. Sink will have to win without high turnout like Obama had in 2008 but she is more popular in rural areas so margins there may make up for lost young and minority votes.
Sink's background: she worked with Bank of America until Governor Lawton Chiles (D) appointed her for the state education commission. She then ran for CFO in 2006 and defeated Tom Lee (R)
McCollum's background: he was a congressman from Orlando from 1980 to 2001, representing Disney World at one point. He ran for Senate in 2000 losing 51%-46% to Bill Nelson who prevented McCollum from having large margins in rural areas. In 2006, McCollum ran for Attorney General and won, winning large margins in the I-4 Corridor.
About Florida regions if you are not familiar with them: the Gold Coast is the Miami to Palm Beach coastline, the I-4 Corridor includes Tampa, Orlando, Daytona Beach and the other areas near I-4. The rest of Floria is...the rest of Florida.
How I did the baselines: I added the percentages of each county from the 2006 CFO election, 2006 Attorney General election and 2008 Presidential election and divided the result by three. I then subtracted 1 point from Sink. The percentages below show how the Gubernatorial election will look if the race ties. Here are some helpful links:
For 2006 CFO election: http://election.dos.state.fl.us/elections/resultsarchive/Index.asp?ElectionDate=11/7/2006&DATAMODE=
For 2006 Attorney General election: http://election.dos.state.fl.us/elections/resultsarchive/Index.asp?ElectionDate=11/7/2006&DATAMODE=
For 2008 Presidential election: http://www.uselectionatlas.org/RESULTS/
Now finally the baselines:
County name Sink McCollum Other
Alachua 59% 40% 1%
Baker 27% 72% 1%
Bay 32% 67% 1%
Bradford 35% 64% 1%
Brevard 45% 54% 1%
Broward 66% 33% 1%
Calhoun 42% 57% 1%
Charlotte 44% 55% 1%
Citrus 44% 55% 1%
Clay 28% 71% 1%
Collier 35% 64% 1%
Columbia 39% 60% 1%
DeSoto 43% 56% 1%
Dixie 42% 57% 1%
Duval 44% 55% 1%
Escambia 38% 61% 1%
Flager 49% 50% 1%
Franklin 47% 52% 1%
Gadsden 72% 27% 1%
Gilchrest 39% 60% 1%
Glades 47% 52% 1%
Gulf 43% 56% 1%
Hamilton 51% 48% 1%
Hardee 36% 63% 1%
Hendry 45% 54% 1%
Hernando 47% 52% 1%
Highlands 41% 58% 1%
Hillsborough 48% 51% 1%
Holmes 31% 68% 1%
Indian River 40% 59% 1%
Jackson 43% 56% 1%
Jefferson 60% 39% 1%
Lafayette 38% 61% 1%
Lake 41% 58% 1%
Lee 41% 58% 1%
Leon 63% 36% 1%
Levy 44% 55% 1%
Liberty 45% 54% 1%
Madison 56% 43% 1%
Manatee 45% 54% 1%
Marion 44% 55% 1%
Martin 42% 57% 1%
Miami-Dade 56% 43% 1%
Monroe 52% 47% 1%
Nassau 31% 68% 1%
Okaloosa 26% 73% 1%
Okeechobee 46% 53% 1%
Orange 53% 46% 1%
Osceola 52% 47% 1%
Palm Beach 62% 37% 1%
Pasco 46% 53% 1%
Pinellas 51% 48% 1%
Polk 44% 55% 1%
Putnam 44% 55% 1%
Santa Rosa 27% 72% 1%
Sarasota 48% 51% 1%
Seminole 43% 56% 1%
St. Johns 34% 65% 1%
St. Lucie 53% 46% 1%
Sumter 37% 62% 1%
Suwanee 38% 61% 1%
Taylor 44% 55% 1%
Union 35% 64% 1%
Volusia 51% 48% 1%
Wakulla 50% 49% 1%
Walton 30% 69% 1%
Washington 34% 65% 1%
Now for those of us (like me) who like visual aides, here is a map of the county percentages.
Dark Red: McCollum 65%+
Red: McCollum 60%-64%
Lighter Red: McCollum 55%-59%
Even Lighter Red: McCollum 50%-54%
Turquoise: Sink 50%-54%
Blue: Sink 55%-59%
Dark Blue: Sink 60%-64%
Even Darker Blue: Sink 65%+
A little more analysis:
The map shows Sink doing well along the Gold Coast, the Tallahassee area while winning a few counties in the I-4 corridor. McCollum does well in the rest of the state, winning the Jacksonville area, the whiter retiree communities in the north and south as well as the Pensacola area. To nitpick, Sink did very well in the rural counties around Tallahassee in 2006 but since they are trending rightward, the maps show her winning much less than she did in 2006. Also, McCollum is from Orange County (Orlando) so this should help reduce Sink's margin there (McCollum won 55% in Orange County in 2006) but Orange County's leftward shift should give Sink a small margin, as shown in the map.
Overall, the counties colored blue appear to not match Obama's coalition which produced big margins in Orange County but not around Tallahassee. The results should be similar to a regular Florida election.
Sink's background: she worked with Bank of America until Governor Lawton Chiles (D) appointed her for the state education commission. She then ran for CFO in 2006 and defeated Tom Lee (R)
McCollum's background: he was a congressman from Orlando from 1980 to 2001, representing Disney World at one point. He ran for Senate in 2000 losing 51%-46% to Bill Nelson who prevented McCollum from having large margins in rural areas. In 2006, McCollum ran for Attorney General and won, winning large margins in the I-4 Corridor.
About Florida regions if you are not familiar with them: the Gold Coast is the Miami to Palm Beach coastline, the I-4 Corridor includes Tampa, Orlando, Daytona Beach and the other areas near I-4. The rest of Floria is...the rest of Florida.
How I did the baselines: I added the percentages of each county from the 2006 CFO election, 2006 Attorney General election and 2008 Presidential election and divided the result by three. I then subtracted 1 point from Sink. The percentages below show how the Gubernatorial election will look if the race ties. Here are some helpful links:
For 2006 CFO election: http://election.dos.state.fl.us/elections/resultsarchive/Index.asp?ElectionDate=11/7/2006&DATAMODE=
For 2006 Attorney General election: http://election.dos.state.fl.us/elections/resultsarchive/Index.asp?ElectionDate=11/7/2006&DATAMODE=
For 2008 Presidential election: http://www.uselectionatlas.org/RESULTS/
Now finally the baselines:
County name Sink McCollum Other
Alachua 59% 40% 1%
Baker 27% 72% 1%
Bay 32% 67% 1%
Bradford 35% 64% 1%
Brevard 45% 54% 1%
Broward 66% 33% 1%
Calhoun 42% 57% 1%
Charlotte 44% 55% 1%
Citrus 44% 55% 1%
Clay 28% 71% 1%
Collier 35% 64% 1%
Columbia 39% 60% 1%
DeSoto 43% 56% 1%
Dixie 42% 57% 1%
Duval 44% 55% 1%
Escambia 38% 61% 1%
Flager 49% 50% 1%
Franklin 47% 52% 1%
Gadsden 72% 27% 1%
Gilchrest 39% 60% 1%
Glades 47% 52% 1%
Gulf 43% 56% 1%
Hamilton 51% 48% 1%
Hardee 36% 63% 1%
Hendry 45% 54% 1%
Hernando 47% 52% 1%
Highlands 41% 58% 1%
Hillsborough 48% 51% 1%
Holmes 31% 68% 1%
Indian River 40% 59% 1%
Jackson 43% 56% 1%
Jefferson 60% 39% 1%
Lafayette 38% 61% 1%
Lake 41% 58% 1%
Lee 41% 58% 1%
Leon 63% 36% 1%
Levy 44% 55% 1%
Liberty 45% 54% 1%
Madison 56% 43% 1%
Manatee 45% 54% 1%
Marion 44% 55% 1%
Martin 42% 57% 1%
Miami-Dade 56% 43% 1%
Monroe 52% 47% 1%
Nassau 31% 68% 1%
Okaloosa 26% 73% 1%
Okeechobee 46% 53% 1%
Orange 53% 46% 1%
Osceola 52% 47% 1%
Palm Beach 62% 37% 1%
Pasco 46% 53% 1%
Pinellas 51% 48% 1%
Polk 44% 55% 1%
Putnam 44% 55% 1%
Santa Rosa 27% 72% 1%
Sarasota 48% 51% 1%
Seminole 43% 56% 1%
St. Johns 34% 65% 1%
St. Lucie 53% 46% 1%
Sumter 37% 62% 1%
Suwanee 38% 61% 1%
Taylor 44% 55% 1%
Union 35% 64% 1%
Volusia 51% 48% 1%
Wakulla 50% 49% 1%
Walton 30% 69% 1%
Washington 34% 65% 1%
Now for those of us (like me) who like visual aides, here is a map of the county percentages.

Dark Red: McCollum 65%+
Red: McCollum 60%-64%
Lighter Red: McCollum 55%-59%
Even Lighter Red: McCollum 50%-54%
Turquoise: Sink 50%-54%
Blue: Sink 55%-59%
Dark Blue: Sink 60%-64%
Even Darker Blue: Sink 65%+
A little more analysis:
The map shows Sink doing well along the Gold Coast, the Tallahassee area while winning a few counties in the I-4 corridor. McCollum does well in the rest of the state, winning the Jacksonville area, the whiter retiree communities in the north and south as well as the Pensacola area. To nitpick, Sink did very well in the rural counties around Tallahassee in 2006 but since they are trending rightward, the maps show her winning much less than she did in 2006. Also, McCollum is from Orange County (Orlando) so this should help reduce Sink's margin there (McCollum won 55% in Orange County in 2006) but Orange County's leftward shift should give Sink a small margin, as shown in the map.
Overall, the counties colored blue appear to not match Obama's coalition which produced big margins in Orange County but not around Tallahassee. The results should be similar to a regular Florida election.
Wednesday, April 28, 2010
Nevada Senate County Baselines

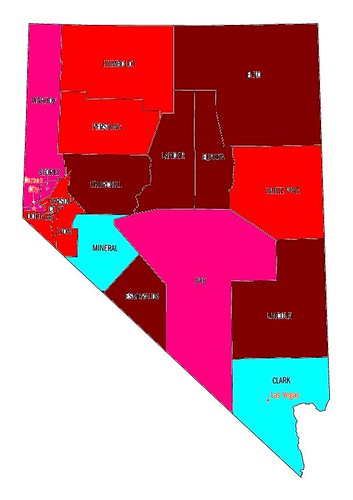
 Dark Red: Republican 70%+
Red: Republican 60%-69%
Light Red: Republican 50%-59%
Light Blue: Reid 50%-54%
This map above is the visual for the Nevada Senate county baselines. Reid is currently unpopular because the Senate is unpopular and Reid is the Senate Majority Leader. Also, the economy in Nevada is bad after the foreclosure crisis and the decrease in tourists so Nevadans will be blaming the incumbent. About 20 candidates are running against Reid in the Republican primary. Since the primary does not occur until June 8th, I do not know who the Republican nominee will be. Most polls suggest Sue Lowden (who Keith Olbermann calls the chicken lady,) a State Senator from Republican areas in Clark County will be the nominee. Recently, she damaged her chances by talking about bartering healthcare for chickens. Still, a recent poll showed her with a lead of 17 points in the primary. No recent poll has shown her lead (or hopefully deficit) compared to Reid. Also, Lowden benefits from the fact that Clark County will not see a high African American turnout or Hispanic turnout (which definitely will change if the immigration bill gets the Hispanic community active.)
A bit about Reid's past elections: in 2004, he won 61%-35% against Richard Ziser, a real estate investor from Las Vegas. Reid even won the majority of voters outside of Clark County (Las Vegas.) Being a Mormon may have helped in rural areas but now that the rural areas are prime teabagger territory, Reid may not keep down Republican margins there. In 1998, it was not as easy. John Ensign (R), the now disgraced Republican Junior Senator of Nevada ran against Harry Reid. Ensign lost by only 100 votes while losing Clark County by nine but barely winning Washoe County (Reno).
About the baselines: the baselines show the candidates' percentages for each county if the race were a tie. I found them by adding percentages from Reid's 2004 Senatorial election and the 2008 presidential election. Then I divided the result by two, giving me the baselines. After some links, you will see them.
Link for 2004 Senatorial election: http://www.uselectionatlas.org/RESULTS/
Link for 2008 Presidential election: http://www.uselectionatlas.org/RESULTS/
County Name Reid Republican Other
Carson City 45% 54% 1%
Churchill 29% 70% 1%
Clark 54% 45% 1%
Douglas 35% 64% 1%
Douglas 35% 64% 1%
Elko 27% 72% 1%
Esmerelda 23% 76% 1%
Eureka 21% 78% 1%
Humboldt 34% 65% 1%
Lander 29% 70% 1%
Lincoln 24% 75% 1%
Lyon 35% 64% 1%
Mineral 52% 47% 1%
Nye 41% 58% 1%
Pershing 37% 62% 1%
Storey 42% 57% 1%
Washoe 49% 50% 1%
White Pine 38% 61% 1%
Friday, April 23, 2010
Maryland County Baselines
 Dark Red=Ehlrich 70%+
Red=Ehlrich 60%-69%
Light Red=Ehlrich 50%-69%
Blue=O'Malley 60%-69%
Dark Blue= O'Malley 70%+
This is a map for those who like visual aides like myself. This is for the baselines which I will explain below.
Robert Ehlrich (R), the former Governor of Maryland is running against Martin O' Malley (D) the incumbent Governor of Maryland. This is like a repeat of 2010 because the two same candidates are running for the same seat, except O'Malley is the Governor this time. Yes, Maryland is a Democratic state where Obama won 62% but a recent Rasmussen poll showed O' Malley ahead by only three points. http://www.rasmussenreports.com/public_content/politics/elections2/election_2010/election_2010_governor_elections/maryland/election_2010_maryland_governor
Rasmussen usually leans to the right in their polling but still, Maryland should have a competitive race. Obama had a boost from high African American turnout but most political people believe it will be lower. For your knowledge and enjoyment, I have created the baseline for Maryland counties which are the expected percentages for each candidate by county if the race is tied. I factored in the 2006 Gubernatorial election because Ehlrich and O'Malley were the candidates in it. I also factored in the 2008 Presidential election because the results are more recent and should reflect Republican and Democratic trends. The two elections combined should offer a clear picture of Maryland's county baselines. The math I used was adding the 2006 and 2008 Republican and Democratic percentages. I then divided by two and subtracted 8 from the Democratic percentage for the baseline.
A bit about Ehlrich and O' Malley's past elections: Ehlrich won in 2002 by running far ahead of Republican percentages in the Baltimore County suburbs of Anne Arundel and Baltimore County (which does not include Balitmore City.) Ehlrich used to represent a congressional district in Republican Baltimore suburbs. In 2006, he was unable to pull big margins from them because O'Malley is the former mayor of Baltimore City and he was popular with the working class Baltimore suburban voters Ehlrich won in 2002. For example, he won Baltimore County with 61% in 2002 but lost by 300 votes in 2006. For Ehlrich to win, he needs to do very well with the working class voters. He did not so he lost with 53%-46%. Enough talk about elections, here are the baselines:
Rasmussen usually leans to the right in their polling but still, Maryland should have a competitive race. Obama had a boost from high African American turnout but most political people believe it will be lower. For your knowledge and enjoyment, I have created the baseline for Maryland counties which are the expected percentages for each candidate by county if the race is tied. I factored in the 2006 Gubernatorial election because Ehlrich and O'Malley were the candidates in it. I also factored in the 2008 Presidential election because the results are more recent and should reflect Republican and Democratic trends. The two elections combined should offer a clear picture of Maryland's county baselines. The math I used was adding the 2006 and 2008 Republican and Democratic percentages. I then divided by two and subtracted 8 from the Democratic percentage for the baseline.
A bit about Ehlrich and O' Malley's past elections: Ehlrich won in 2002 by running far ahead of Republican percentages in the Baltimore County suburbs of Anne Arundel and Baltimore County (which does not include Balitmore City.) Ehlrich used to represent a congressional district in Republican Baltimore suburbs. In 2006, he was unable to pull big margins from them because O'Malley is the former mayor of Baltimore City and he was popular with the working class Baltimore suburban voters Ehlrich won in 2002. For example, he won Baltimore County with 61% in 2002 but lost by 300 votes in 2006. For Ehlrich to win, he needs to do very well with the working class voters. He did not so he lost with 53%-46%. Enough talk about elections, here are the baselines:
Wait, here are some helpful links:
For 2006 election: http://www.cnn.com/ELECTION/2006//pages/results/states/MD/G/00/county.000.html
For 2008 election:
http://www.cnn.com/ELECTION/2008/results/county/#MDP00p1
For 2008 election:
http://www.cnn.com/ELECTION/2008/results/county/#MDP00p1
Now finally the baselines:
County name O'Malley Ehlrich Other
Alleghany 32% 67% 1%
Anne Arundel 38% 61% 1%
Baltimore County 46% 53% 1%
Balitmore City 73% 26% 1%
Calvert 36% 63% 1%
Caroline 27% 72% 1%
Carrol 23% 76% 1%
Cecil 34% 65% 1%
Charles 49% 50% 1%
Dorcester 33% 66% 1%
Frederick 36% 63% 1%
Garrett 22% 77% 1%
Harford 30% 69% 1%
Howard 48% 51% 1%
Kent 39% 60% 1%
Montgomery 60% 39% 1%
Montgomery 60% 39% 1%
Prince George's 76% 23% 1%
Queen Anne's 26% 73% 1%
Somerset 36% 63% 1%
St. Mary's 33% 66% 1%
Talbot 32% 67% 1%
Washington 32% 67% 1%
Wicomico 34% 65% 1%
Worcester 30% 69% 1%
As seen in the baselines, O'Malley only wins the big three (Baltimore City, Montgomery and Prince George's Counties.) I think he should barely win Charles County which is trending Democratic quickly. Overall, the baselines should fluctuate a bit but I wanted to stay with election results, not my personal opinion on each county. Any thoughts?
Saturday, April 3, 2010
We Cannot Drill Our Way Out of this
First things first, my letter about oil drilling just got published in the chronicle! Here it is:http://www.sfgate.com/cgi-bin/article.cgi?f=/c/a/2010/04/01/EDA31COH4M.DTL
Tuesday, February 9, 2010
New Jersey Redistricting with Christie in Office
 Camden and Vicinity
 Southern New Jersey
 Central New Jersey
 Western New Jersey
 Urban New Jersey
 Northern New Jersey
The census should show that New Jersey will lose one congressional district. Currently, New Jersey has 8 Democrats and 5 Republicans representing it in the House of Representatives. Democrats control New Jersey's State Legislature and Governor Christie is a Republican so I expect there will be a bipartisan deal. I combined the districts of Rush Holt (D) and Leonard Lance (R) in a district that leans Democratic but Lance can win in it since it contains alot of his current district. I strengthened all the other incumbents and kept the 10th and 12th district African American and Hispanic majority respectively. For this map, I tried to not make it too convoluted because realistically, I do not see that happening. Also, I calculated the partisan data for these districts by town and I tried not to split the towns. I had to in a few cases but the partisan data should be accurate most of the time. Also, I calculated it for the top two candidates only. Here are some helpful links
For election results by county: http://www.uselectionatlas.org/RESULTS/
For results by town: http://njelections.org/2008_general_election.html
For map of current congressional districts: http://www.govtrack.us/congress/findyourreps.xpd?state=NJ
For results by town: http://njelections.org/2008_general_election.html
For map of current congressional districts: http://www.govtrack.us/congress/findyourreps.xpd?state=NJ
For map of the state: maps.google.com
District 1 Rob Andrews (D)
Demographics: 17% African American, 10% Hispanic and 68% White Partisan data: Obama 209,913 64%, McCain 116,314 36%
Communities of interest: Camden, Pennesauken
The district grows a bit more Republican. I removed the Democratic neighborhoods in Burlington County to help strengthen the 3rd district. I also added more of Gloucester County and the areas I added are marginal. I also added a heavily Democratic slice of Salem County. Overall, I made mostly minor changes so Rob Andrews should have no trouble with reelection. Status is Safe Democrat
District 2 Frank LoBiondo (R)
Demographics: 9% African American, 11% Hispanic and 76% White
Partisan data: Obama 179,951 49%, McCain 188,164 51%
Communities of interest: Vineland, Atlantic City, Berkeley
LoBiondo looks safe in his current district but since Obama won his current district 54%-45%, a bipartisan plan would strengthen him. To strengthen LoBiondo, I mostly removed Democratic areas. I removed Democratic parts of Salem County and some Democratic areas in Cumberland County. Since LoBiondo lives in Vineland, I could not remove it. I also removed small parts of Atlantic County but Obama barely won them. The main additions in Burlington County are Medford and Southampton which lean Republican. To completely shore up LoBiondo, I added about half of Ocean County and McCain won a 25,000 vote margin in the portion I added. These changes help boost McCain's performance from 45% to 51%, ensuring LoBiondo safety and his sucessor's safety too. Status is Safe Republican.
District 3 John Adler (D)
Demographics: 20% African American, 10% Hispanic and 64% White
Partisan data: Obama 202,172 63%, McCain 120,457 37%
Partisan data: Obama 202,172 63%, McCain 120,457 37%
Communities of interest: Cherry Hill, Burlington, Trenton
I definitely strengthened Adler so he will have no problems with reelection. I strengthened him a bit too much though. I removed all of heavily Republican Ocean County while adding territory in South Jersey that leans Democratic as well as more Democratic territory in Burlington County. I also added Trenton which voted 92% for Obama so that brings up the Democratic total. I had to give Adler Trenton because I do not see Christie signing a bill with Trenton in the 7th district. Overall, Adler should have no problem in this district. Corzine won it in his unsucessful Gubernatorial run in 2009. Status is Safe Democratic.
District 4 Chris Smith (R)
Demographics 8% Hispanic, 83% White
Partisan Data: Obama 138,535 43%, McCain 184,011 57%
Communities of interest: Toms River, Lakewood, Freehold
Chris Smith seemed safe already, even with Democratic parts of Mercer and Burlington Counties inside his district. He lives in the Democratic parts of the district but he would probably not mind moving as long as his district is safer. I increased McCain's percentage from 52% to 57% by removing most of the Democratic areas along the Delaware River and adding more Republican areas in Monmouth County. Smith should have absolutely no problem here. Status is Safe Republican.
District 5 Scott Garrett (R)
Demographics: Hispanic 6%, Asian 6%, 85% White
Partisan Data: Obama 154,049 43%, McCain 215,083 57%
Communities of Interest: Newton, Rockaway and Montvale
This district does not go through large changes but the few I made strengthen Garrett. I removed marginal towns in Bergen County such as Bergenfield and Ridgewood. I mostly did this because the 9th district needed room to expand. I added in some Republican townships in Morris County. I also kept Garrett's home, Wantage in the district. Increasing the McCain percentage here should keep Garrett safe for until he retires. Status is Safe Republican.
District 6 Frank Pallone (D)
Demographics: 11% African American, 13% Hispanic, 16% Asian and 58% White
Partisan Data: Obama 165,102 58%, McCain 117,226 42%
Communities of Interest: Edison, Asbury Park, New Brunswick
Pallone's district gets a bit weaker. I removed Plainfield to give more African Americans to the 10th and since I tried to keep town boundries intact, I removed the small Democratic slice of Somerset County. I replaced it with Woodbridge and Edison which lean Democratic even though Christie barely won them. Still, Pallone is entrenched here and since the minority population is growing quickly here (the white population was 65% in 2000,) this district should grow more Democratic. Pallone should not have trouble. Status is Safe Democrat.
District 7 Rush Holt (D) vs. Leonard Lance (R)
Demographics: 9% African American, 8% Hispanic, 13% Asian and 69% White
Partisan Data: Obama 215,083 58%, McCain 154,049 42%
Communities of Interest: Ewing, North Brunswick
This district may at first look like a sure win for Holt because he has represented his district since the 90's and this district contains most of his old territory. Lance is a freshman but he is a moderate. He also ran a great campaign in 2008, winning against Linda Stender (D) by nine points in a district Obama barely carried. Stender was a good candidate and she almost beat Mike Ferguson (R) who formerly represented the 7th district in 2006. Also, the territory here is less Democratic than it looks with high income independents who swung heavily toward Christie in the Gubernatorial race last year. About the areas in the district, I had to remove Trenton because I think Christie would never sign a plan putting Lance in the same district as Trenton. Still, the district is Democratic with other parts of Mercer County as well as Democratic areas in Middlesex County. Overall, this should be a tough battle but Holt should win. Status is Lean Democratic.
8th District Bill Pascrell (D)
Demographics: 11% African American, 29% Hispanic, 7% Asian and 53% White
Partisan Data: Obama 193,000 +-2,000 63% McCain 113,000 +-2,000 37%
Communities of Interest: Westfield, West Orange, Paterson, Clifton
I had to split some towns in this district so the vote totals are not exact. Overall, his district gets more Democratic by a few points. I removed all the Republican parts of Passaic County, leaving only Paterson, Clifton, Passaic and a few small Democratic suburbs. Obama won 74% of the vote in the 8th district's part of Passaic. I added most of western Union County which Obama and McCain split but most of the time, Republicans should win that area. I also added a slice of Bergen County which is also split between Obama and McCain. These changes should not affect Pascrell much because Paterson and neighborhoods in Essex County keep this district strongly Democratic. Status is Safe Democratic.
9th District Steven Rotham (D)
Demographics: 7% African American, 20% Hispanic, 16% Asian and 56% White
Partisan Data: Obama 181,000 +-1,000 62%, McCain 113,000 +-1,000 38%
Communities of Interest: Jersey City (part,) Englewood, Hackensack, Garfield
Rotham's district gets a touch more Republican but does not make many changes. I gave the district some northern Bergen County suburbs such as Bergenfield and Tenafly which lean Democratic. The only areas I removed were Fairview and North Bergen which are heavily Democratic. These changes should not affect the composition of the district strongly. Status is Safe Democratic.
10th District Donald Payne (D)
Demographics: 55% African American, 17% Hispanic and 23% White
Partisan Data: 82% Obama, 18% McCain
Communities of Interest: Plainfield, Rahway, Linden, Elizabeth, East Orange, Newark
Since I split most of the towns in the district, I decided to just estimate the partisan data. Also, Payne's district changes a bit. I did not remove many areas from it but I added Plainfield and the marginal Union County suburbs for a few reasons: Plainfield has an African American majority and since the 10th is New Jersey's African American majority district, I decided it should be included. Also, the 10th helps shore up the 8th by taking in some marginal suburbs. I am not sure if the New Jersey legislature would go for this but since it would help keep the 10th African American majority, they would go for it. The district still remains heavily Democratic. Status is Safe Democratic.
11th District Rodney Frelinghuysen (R) Harding
Demographics: 11% Hispanic, 9% Asian, 75% White
Partisan Data: Obama 162,166 47%, McCain 184,827
Communities of Interest: Dover, Morristown
I weakened Frelinghuysen a bit by removing all of Republican Sussex and Warren Counties. I also removed parts of Morris County too. The new areas I put in the district are mostly in Somerset, Union and Essex Counties. The new areas are marginal but Obama overperformed in most of the district so Frelinghuysen should still be very safe. Status is Safe Republican.
12th District Albio Sires (D) West New York
Demographics: 10% African American, 53% Hispanic, 7% Asian, 30% White
Partisan Data: Obama 76% McCain 23%
Communities of Interest: Linden, Elizabeth, Jersey City, Hoboken, Newark
Since I split too many towns in this district, I had to estimate the partisan data. Overall, the district experiences few changes. I added all of North Bergen as well as Fairview in Bergen County. I also added a few neighborhoods in Elizabeth but besides this, I made few changes. Sires's district gets more Hispanic and he remains safe. Status is Safe Democratic.
Do you have any suggestions for improving this redistricting plan? Do you have a redistricting map or idea you want to share? Please feel free to share your thoughts.
Do you have any suggestions for improving this redistricting plan? Do you have a redistricting map or idea you want to share? Please feel free to share your thoughts.
Subscribe to:
Posts (Atom)