Tuesday, April 12, 2016

Key Counties to Watch in the New York Primary


On April 19th, the New York primary will take place. Donald Trump is expected to win on the Republican side but on the Democratic side, if Secretary Clinton wins here and she wins with a large margin (10% or more), she could solidify her position as the frontrunner and make her delegate lead nearly insurmountable in top of the media fallout that would have occurred if she were not victorious.

Sen. Sanders has had a string of wins and is hoping that if he wins New York, the win can generate momentum to carry California and then give him the imputes to persuade super delegates to support him. At the same time, Sen. Sanders  needs to win 56% of the remaining delegates and if he loses New York by more than 10 points, not only does the delegate deficit  become larger, he loses the momentum he needs for any success the campaign would have. The RCP polling average shows Secretary Clinton with a 14 point lead, showing  she is on track to win with the margin she needs.   Furthermore, one of the most demographically favorable states for him, Wisconsin went for him by 14 points, barely above the 12 point average he needs through the rest of the contest and not enough for any significant changes in the race for the nomination.

This article is  a county by county analysis showing which counties and demographic groups to watch on Election night.

Sen. Sanders’ strategy: Win crushing margins in Upstate, especially in the 21st district (near Vermont), keep Hillary’s margins in the New York City Boroughs low, win Manhattan and win Suffolk County. Also outperform the Teachout map (Zephyr Teachout  was a Progressive primary challenger for Governor Cuomo in 2014 and lost by 28 points but played well with white rural upstate voters).
Teachout vs. Cuomo Map:
Yellow = Cuomo
Green = Teachout

Secretary Clinton’s strategy: Win all five boroughs, win overwhelming margins  with African Americans and Latinos, win Suffolk County, win the Lower Hudson River Valley, win all major urban areas Upstate and surprise the pundits by winning some rural counties Teachout won.  

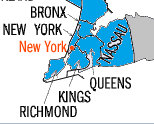
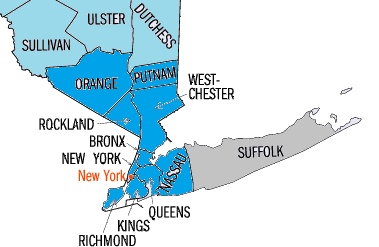
Predicted County Map for the New York Primary:
New York Map election.png
Dark Blue = Clinton
Light Blue = Sanders
Gray = Too close to Call/not enough information

New York City Boroughs:
New York City.png
Brooklyn:
Yes, Brooklyn may be famous for its hipsters and I am sure we all know which Democratic candidate  hipsters will back. At the same time, Brooklyn has a large African American population (34%) and a large Jewish population (23%). Many of those Jews are Orthodox and as shown by Hillary’s margins in heavily Jewish Palm Beach County in Florida, she is very popular with New York Jews. A Fox News poll also showed her with a 59%-35% lead among Jews, and it is probably higher with Orthodox Jewish population. While Sen. Sanders may play better with younger and more secular Jews in Manhattan, there are many Orthodox Jews in Brooklyn who should wind up voting for Clinton. My grandmother grew up in Brighton Beach so I have a genuine  connection to Brooklyn and have learned very much about the Brooklyn culture from her. Secretary Clinton won Brooklyn by under one point in 2008 vs. then Sen. Barack Obama despite performing poorly with the African American community.  With the added support from African Americans, Hillary should increase her margin and win Brooklyn with 58%-60% of the vote.  

Staten Island:
On paper, Staten Island should be Sen. Sanders country. It is white and working class. At the same time, it should support Secretary Clinton because many Democrats here are generally conservative and also, there is a growing minority population as well that would keep the Sanders numbers lower than anticipated.

Manhattan:
While Sen. Sanders may not win Manhattan, this is the borough he would have the best chance to win. The reason is that while many voters here may be the “limousine” liberals that would potentially vote for Sanders, there are large numbers of college students in NYU and Columbia that would vote with Sanders. Secretary Clinton will likely win Manhattan due to strong support from Harlem and Washington Heights (Manhattan has an 18% African American population and a 26% Hispanic population) but it could be close.

Queens:
Sen. Sanders may play better here than Brooklyn but the 21% African American and 28% Latino figures do not help him. Still I expect a tighter margin here than in Brooklyn (about 56%-57% for Secretary Clinton). The reason is that Queens is 25% Asian and Bernie has been shown to perform better with Asian voters than African American and Latino voters.

Bronx:
If Secretary Clinton’s margins with Puerto Ricans are similar to her Floridian margins with Puerto Ricans (many Floridian Puerto Ricans moved there from New York), expect a resounding performance here, with about 65% of the vote. If Sen. Sanders does better than expected  among Latinos (one poll shows a tie while others show Secretary Clinton leading with Latinos), expect a Secretary Clinton win but narrower (57%).


Suburban Counties:
New York suburbs.png

Nassau County:
Attacking Wall Street works across most of the country but in Nassau County with cities such as Great Neck and Oyster Bay with large Wall Street populations, it definitely does not. Secretary Clinton should win Nassau County and having heavily African American Hempstead in the county does not hurt either (Nassau County is 13% African American).

Rockland County:
Despite being Jewish, Sen. Sanders has struggled to perform well with older and Orthodox Jewish voters (but plays better with secular, younger and Progressive Jews) as mentioned earlier. Due to the high Orthodox Jewish population in Rockland County with a 31% Jewish population (highest % of Jews in any county in the U.S), I would expect a solid victory for Secretary Clinton.

Suffolk County:
If Sen. Sanders wins one suburban county, it will be this one. The African American and Hispanic populations are lower here. There is also less wealth here than in Nassau County and many of the middle class south shore voters may be open to Sanders. If Sanders fails to win Suffolk County, expect a bad night for him.

Westchester County:
Besides being Secretary Clinton’s home as a Senator, Westchester County was almost made for her. Not only does it have a sizable African American and Latino population (16% and 24% respectively), it also has large number of wealthy white voters. Those voters are Secretary Clinton’s strength (as shown in the Massachusetts suburbs on Super Tuesday) so she should perform well here.

Upstate New York:
Upstate New York.png
I expect Sen. Sanders to play  well here and win most of the central rural counties, due to the high number of progressive rural white voters and proximity to his home state Vermont (yes, I expect Secretary Clinton to lose “Clinton County” because it borders Vermont and has the demographic profile of counties Sen. Sanders wins). Secretary Clinton though has relationships in Upstate Counties and performed well in the 2008 primary. The NBC poll shows Sen. Sanders with a 1 point lead in Upstate, suggesting a close race here. The counties where Secretary Clinton can perform the best include:

Erie County (Buffalo):
On March 15th, Secretary Clinton surprised many pundits by not only winning Ohio but winning by 14 points and winning urban areas that faced large manufacturing job loss such as Cleveland and Toledo. Buffalo is similar demographically to many of those Ohio cities and Erie County has a 13% African American population, suggesting Secretary Clinton should play well here.

Albany County:
Due to the 12% African American population and large number of voters here involved in New York politics (New York politicians and political workers are firmly behind Secretary Clinton), I expect she will carry Albany County.

Monroe County (Rochester):
With the 16% African American population and similarity to Buffalo, Secretary Clinton  should win here as well.

Orange County:
This county is a fine boundary between Upstate and Downstate with a small population of Jewish voters, some Latinos (19%) and some African Americans (12%). I expect a Secretary Clinton  win here due to demographics and Orthodox Jews in places such as Kiryas Joel but the progressives here may keep it close for Sen. Sanders.

Other borderline Upstate/NYC Metro Counties: I expect Secretary Clinton to win Putnam County due to the high income level of the voters. The counties Bernie should win include Dutchess and Ulster (Secretary Clinton won Ulster by only 3 in 2008).

Conclusion:
Overall, I expect a 10%-15% win for Secretary Clinton in New York. Her ability to win demographic groups such as African Americans, Latinos and Jews will be extremely helpful here, as well as Bernie’s stalled momentum after the Daily News Interview, the delegate tie in Wyoming (most pundits expected a blowout there), and the “not qualified” comment he recently made.

Here is how I see New York Regionally:
Secretary Clinton will most likely win all five boroughs with the closest being Manhattan..
Secretary Clinton will win all the suburban counties with the possible exceptions of Suffolk and Orange Counties.
Secretary Clinton will lose in Central Upstate due to the Progressive streak and proximity to Vermont but may do well in Western New York (Buffalo, Rochester) due to the similarities to the voters she won in Ohio and relationships she previously built as Senator.

Monday, March 28, 2016

Will Trump Hurt House Republicans?


Cross posted on racesandredistricting.blogspot.com which has more election analysis. 
We are also on Facebook: www.facebook.com/...
Recently, the cook political report updated its House race ratings and all ten races favored Democrats. Before mid March of 2016, most pundits assumed that Democrats could not take the House. Trump may be the nomiee  and can harm downballot Republican candidates with his hateful rhetoric. While the downballot Republicans may not make the statements themselves, many will endorse Trump for President and many may appear with him at rallies. One however has already implied that he will not endorse Trump and possibly even vote for Hillary. This representative, Carlos Cuebelo (R) represents FL-26, a Democratic leaning and heavily Hispanic district that he narrowly won in 2014. 
The main question is though how strong of an impact will Trump have on downballot races? My answer is that if his candidacy causes high Democratic turnout, it will. If Trump’s candidacy does not generate high turnout among Democrats but only causes Independents to switch, it will not. As shown in states such as Ohio, Virginia and New York, Democratic wave elections that rely on low propensity voters (infrequent voters) have stronger downballot effects than wave elections that rely on persuading Independents.  
1. Ohio in 2006: Ohio in 2006 is a prime example of how top of the ticket races that rely on persuading voters instead of turning out base voters do not help downticket. In 2006, Rep. Ted Strickland (D) won the Governorship with 60%. He won for a couple of reasons. One was that Strickland’s opponent, Secretary of State Kenneth Blackwell (R) was unpopular statewide. Strickland also ran touting his moderate roots and connection to Appalachia (he represented a congressional district in southeastern Ohio). At the same time, Democrats failed to make major gains in House  seats. They only gained one, Rep. Bob Ney’s (R) seat which could have been explained as the result of a scandal. 
Ohio_2006_Gov.png
Ohio 2006 Gubernatorial Election results (red and blue are switched) 
As shown by the 2006 exit polls, turnout among key groups such as African Americans, Democrats and young voters remained similar to 2004 but Independents backed Strickland by 43 points. Therefore, Republicans won House seats such as OH-15 which was located in the Columbus area and strongly backed Strickland. The reason the Republican won though was that the voters were not low propensity Democrats but regular voters who backed Republicans in the past (OH-15 supported Bush in 2004) and decided to stick with Republicans downballot. Columbus has a high number of  college students and African Americans so a high  turnout among those groups would be problematic for Republicans in this district. The same happened in OH-01 as well which voted for  Bush by 2 points in 2004. The district is located around Cinncinatti and has a high African American population (27%).  
In 2008 however, although Obama won by five points instead of 24 in Ohio, turnout was stronger among young voters, African Americans and Democrats. OH-15 flipped however with help from high turnout from African Americans and young voters in Franklin County (Columbus). OH-01 flipped as well. With high  African American turnout in Cinncinati, OH-01 flipped as well. 
2. 2008 Virginia: in 2008, President Obama won Virginia by seven points, thanks to high turnout among upscale liberals/Hispanics/Asians  in Northern Virginia, high turnout from African Americans in SE  VA and high turnout from college students in areas such as Charlottesville. It is no surprise that Democrats gained three House seats in Virginia in 2008 despite gaining none in  2006. Even though Democrats won on top of the ticket, Dems won on winning over Independents, not by turning out low propensity voters.  
In 2006, Democrats did win a Senate seat with Jim Webb (D) defeating  Sen. George Allen (R). Webb’s strategy though did not appear to rely on turning out low propensity voters but appeared to rely on winning over blue dog Democrats in SW VA with his moderate views and winning over upscale voters in NoVA due to Allen’s extremism. Allen called an Indian campaign  worker of Webb’s a “macaca” (a racial slur from North Africa). Webb used that to cause upscale voters who may have backed Bush in 2004 (Bush received 46% in Fairfax County, the main suburban county in NoVa), to switch to Webb (Allen won 40% of the Fairfax County vote). At the same time, those voters voted Republican downballot. Take VA-11 for example, it flipped in 2008 when Obama won it by 11 but its Republican incumbent won by 13 points. The reason is  that its incumbent, Tom Davis (R) was a moderate similar to many of the upscale voters who switched from Bush in 2004 to Webb in 2006. If Webb had brought out more low propensity Democrats though, they may have voted against Davis. 
2008 overall was a strong year for Democrats in Virginia. Besides Obama winning statewide by seven points, Democrats also gained VA-2 and VA-5. VA-2 was a district in the Hampton Roads with a sizable African American population that turned out to elect  a Democrat. VA-5 is a rural district with some  African Americans as well as young voters in Charlottesville. 
3. New York 2014: In 2010, Andrew Cuomo (D), then Gubernatorial candidate was thought to be facing a tough race (a poll showed him leading by only 6 points). Cuomo won by 28 points. Democrats however lost many House seats in New York, especially in Upstate. The reason is that although Cuomo may have won, he won by winning over enough center right voters. The Republican candidate, Carl Paladino (R) was in my opinion in a mini Donald Trump. Paladino told a reporter who asked him a tough question, “I’ll take you out!” Paladino then went on to compare being LGBT to being alcoholic. At his concession speech, Paladino also appeared to threaten newly elected Gov. Cuomo with a baseball bat. One can also make parallels between Paladino and Trump (they both made outlandish statements and both had a chance at winning for awhile) but that is a discussion for another article. 
 In 2014, Cuomo had angered most of the Democratic base and won by only 13 points, despite being on no one’s radar. At the same time though, Democratic turnout was extremely low hurting Democrats across the state. In NY-24 for example, a 57% Obama seat centered around Syracuse, a Republican John Katko (R) won it thanks to low Democratic turnout. Also, Rep.  Bishop (D) lost a Long Island Congressional seat that he had held for 12 years and won through 2010 and the Republican leaning years of 2002 and 2004. 
Conclusion: 
Overall, Trump will hurt House Republicans as long as his candidacy increases Democratic turnout.  It should not be difficult for Democrats to bring out their base regardless of the nominee, especially  with Trump’s hateful comments toward women, hateful comments toward Hispanics and refusal to denounce the KKK. If Trump’s candidacy though fails to turnout the Democratic base and instead mainly persuades moderate suburban Republicans to support the nominee, it will  not have as strong an impact downballot.
Also, both Democrats have arguments that they will increase higher turnout. Hillary’s campaign will argue that they can increase turnout with African Americans and Hispanics and Bernie’s campaign will argue that they will increase turnout among young people. With Trump’s candidacy though, turnout among all three groups should skyrocket. 
At this time, it is still unlikely that Democrats regain the House due to gerrymandering but  they can greatly narrow the GOP majority. At least any swing district Democrats hold with a high Hispanic population will now be safer due to high Hispanic turnout against Trump. What will be important for Democrats though is that besides persuading center right Hispanics, they also need to register and turnout as many low propensity Hispanic voters as they can. As shown in Ohio, New York and Virginia, sweeping Democratic wins have stronger coattail effects when those sweeping Democratic wins are fueled by low propensity voters instead of simply by persuading Independents to vote Democratic in a top of the ticket race.

Tuesday, March 15, 2016

Key Counties to Watch on the March 15th Primaries


The  Super Tuesday 2.0 is here and there are 691 delegates at stake. As  my friend calls it, “Significant Tuesday.” This is a chance for Hillary to secure her 200+ pledged delegate lead or for Sanders to prolong the race. Pundits expect Clinton to win Florida and North Carolina easily while Ohio, Illinois and Missouri should be close (although a few pundits say Sanders will win Missouri). Here are the key counties and regions to watch while the results unfold (on the Democratic side only).

Florida:
Florida is expected to go strongly for Hillary Clinton. The RCP polling average shows Hillary with a  29 point lead. The three main regions are: Gold Coast, I-4 Corridor and outstate Florida.  Hillary should perform well in outstate, mainly because of the high African American population in northern Florida, the elderly voters in the Villages and the wealthy voters on the southwest coast of Florida. She is also expected to do well in  the Gold Coast (Miami) with the high Hispanic, African American and elderly populations. Counties Sanders can try to score an upset:

Alachua County: the University of Florida is here but a  high African American population is here as well. This county will be close.

Counties north of Tampa: counties such as Pasco, Hernando and Citrus are heavily white and not as wealthy as the southwest coast of Florida. These have similar demographics to counties Bernie won in Michigan (and Midwestern transplants). At the same time, the percentage of elderly voters here is almost the highest in the nation so it is likely Bernie cannot even win here.

North Carolina:
This is another state where Hillary is expected to perform well, this time with a 24 point lead in the RCP average. Hillary should perform well in the eastern part of the state due to the high African American population. She should do well in the urban areas of  Raleigh/Greensboro/Charlotte as well. If Bernie wins a few counties, he needs to perform well in:

Western North Carolina: this is Appalachia with a low African American population but as shown in Tennessee, Georgia and Virginia, Hillary wins southern rural white voters.

Durham and Orange Counties: Duke and UNC are here but so are high African American populations.

Charlotte suburbs: Gaston and Union Counties  voted for Hillary by narrow margins in 08. These are heavily white and upscale suburban counties. If Bernie wants to make inroads among the upscale voters he needs to win these.

Ohio:
Here we go to our first  swing state of the evening. The RCP average has Hillary with an 8 point lead but after Michigan, it is highly unlikely that the Clinton folks are taking any chances. Ohio though will probably not be a Michigan repeat because Independents are represented in these polls. Also, Michigan has only one large urban area, Ohio however has:

Cuyahoga County (Cleveland): this county is the center of Ohio’s Democratic base. Obama won here by 260,000 votes in 2008, Kerry won here by 227,000  votes in 2004. It is about 30% African American. Hillary will need those votes and if she wins Cuyahoga County with a margin of 57% or higher, she will probably win statewide. Obama won 54% here with his 8 point loss in 2008.

Franklin County: (Columbus) Franklin County used to be a swing county (Gore won by a few point) but as shown in 2012 (Obama won it by 20) it has become strongly Democratic. It is the 2nd most populous county in Ohio (after Cuyahoga). Obama won 56% here but expect Hillary to do worse because while there is a large African American population (20% of the county), there is a large population of college students as well. There are upscale Democrats  too so Hillary should win (although narrowly). If she loses, expect a good night for Bernie.

Hamilton County (Cincinnati): Hamilton is the 3rd most populated county in Ohio and it was also Obama’s best. With a low number of white Democrats and a 23% African American population, Hillary  should aim to at least match Obama’s percentages in the low 60s.

Lucas County (Toledo): Toledo is a smaller city (Lucas County has roughly 480k people) and Obama lost it by 5 points in 2008 but Hillary should win here. The reason is that she lost Monroe County, Michigan (which borders Toledo) by only one point and Monroe County has a lower African American population than Lucas County does. It depends how big the Hillary win is here though.

Summit County (Akron): this is a county to watch. It has a 13% African American population and a large number of working class union voters who may lean Sanders. Hillary can probably win Ohio without Summit county but if she wins it, Bernie cannot win.

Sanders should do well in the rural part of the state, but Hillary can make a play for:

Southeast Ohio: this is a heavily white and rural area. Hillary though showed that she can win Appalachian voters on March 1st so if she can win northern Appalachian voters and score some surprise wins in rural areas, this is the area to watch. It  voted heavily for her in 08.

Illinois:
This is another close state. Despite a high African American population (15%), a large number of upscale voters and high Obama popularity, Illinois could be a tough state for Hillary. The RCP average has her winning by 2.3 points and the trusty PPP poll has her leading by 3. Here are the key counties to watch:

Cook County (Chicago): nearly half of the state’s Democratic votes live here. Hillary wants a large margin from the south side with its high African American population. She also wants to do well in northern Cook County with upscale Democrats near Evanston similar to the upscale Dems in Massachusetts that helped her win there. Sanders though is making a play for Hispanics, young African Americans and working class voters. He also is tying Hillary to the unpopular mayor Rahm Emanuel.  If Hillary wins Cook County by 5 points or less, she should be worried.

Lake County: is Hillary winning upscale voters? Look no further than Lake County which is north of Cook County, is upscale and suburban. I was phone banking for Hillary here and found mostly Hillary supporters but I do not know how they targeted the voters. Hillary will also look to do well in other upscale areas such as McHenry and DuPage. If she loses Lake County though and gets a five point or lower win in Cook, she will lose Illinois.

Downstate: this is rural Illinois and Sanders needs large margins in the rural areas to win. Hillary though could try to score some upsets in:
-St. Clair/Madison Counties: these are St. Louis suburbs with some heavily African American areas.
-Sangamon County: this is Springfield which also has some heavily African American neighborhoods.
-Pulaski County: this county is 30% African American and at the southern tip of Illinois. This was the only part of Illinois Hillary won in 08 so watch her try to repeat her win there.

Missouri:
This is the state Sanders has the best chance to win. With the state being only 11% African American and having a large white working class population, this is tough terrain for Hillary. PP has  Sanders winning by one point. Nate Silver says Hillary has a 54% chance of winning here.

St. Louis City: African Americans are about half the population here but there are many younger white Democrats as well. Hillary should win here but if her  margin is under 60% she should be concerned.

St. Louis County: with upscale voters, a 20% African American population and Ferguson, Hillary should win here. She also needs to keep her percentage above 60%. Obama won 63% here in his narrow Missouri win.

Jackson County (Kansas City): although there is an African American population in the 20s here, it is more working class and borders Kansas where Bernie performed well. If Hillary loses this county, she is in trouble.

Rural Missouri: although Hillary won rural Iowa on the Missouri border, that may have been more due to her ground game. Sanders should perform well in this part of the state. Hillary though can score some wins in rural counties in southeastern Missouri which border her husband’s home state Arkansas and a few counties in southeast Missouri such as New Madrid have  significant African American populations as well.

Wednesday, March 2, 2016

Three Takeaways for Hillary on Super Tuesday


Super Tuesday was a strong night for Hillary. It was not the knockout she wanted but it was still strong. Sanders failed to cause an upset in any of the heavily diverse southern states (the lowest she won was 64%). He did win Oklahoma but Nate Silver predicted a Sanders win there. Sanders also won Colorado and Minnesota but both states were caucus states which as shown in 2008 do not favor Hillary (although she made gains in both states compared to 2008). At the same time, both states had high white liberal and college aged populations. 
Something else I have noticed is that Hillary has become much more personable. To quote my professor "she should rent an RV from craigslist, travel around the country and stop at small towns unannounced.” She has not done that yet but she has shown moments of spontaneity. Examples of those include when she saw Steve Harvey and seemed really happy to see him. Another time was when she crashed a bachelor party. During that party, I thought she was about to say “Holy s**t” but instead said “Holy moley." A few people I know who know her well said she is very personable one on one and this campaign may be making her a better candidate and letting her express the personality more that she has at one on one meetings. 
In terms of last night however, here are three major takeaways on the Democratic side. 
1. Hillary Clinton won Hispanic  voters overwhelmingly.  This bodes extremely well for her in Florida which is roughly ¼ Hispanic. It also bodes well for her in Arizona, New Mexico and even New York which has a sizable Hispanic population as well. We know Hillary Clinton won Hispanic voters by looking at her numbers in Texas. Along the Rio Grande border, there are counties which are 90%+ Hispanic so they can show how Hispanic voters voted without having white voters dilute the county voters. Hillary won 72% in Webb County (94% Hispanic), 78% in Starr County (97% Hispanic) and 69% in Hildago County (92% Hispanic).  In Nevada, there was debate over who won the Hispanic vote. The Super Tuesday results though confirm that it was probably Hillary. 
2. She held her own with rural white voters. She won them in most regions as well. Yes, she lost rural Minnesota, rural Vermont, western rural Colorado and rural Oklahoma. At the same time, she won overwhelmingly in northern rural Texas. She also won overwhelmingly in rural Arkansas and Tennessee which are heavily white. The key area for her was Appalachia because Bernie said that he could win it because of the poor economy there. Hillary however won Appalachia, although not by a large margin. She won every Appalachian county in Georgia and narrowly won them in VA. Without Vermont, Nate Cohn said that Hillary won 54% in counties that were over 90% white. This means she can run it close or even with Sanders with this demographic in Mi and OH when combined with African American support translates into a win. Also, the white helped her deliver such crushing margins in states such as AL (78%), GA (71%) and Tennessee which is majority Democratic White voters (65%).
3. She is not getting crushed with young voters anymore. She is still losing them but her margins in the South with young voters were nowhere near the 15% she won in the first three caucus states. At first, I thought the shift toward Hillary among young voters was ancedotal as a few of my Bernie supporting friends switched to Hillary. The results on Tuesday show that there is a small shift toward her. This is shown in the county results which surprised even me, as an ardent Hillary supporter. Hillary Clinton won 48% in Travis County, Texas which I thought should have overwhelmingly supported Sanders, due to the high number of college students and liberal white voters. She also won Clarke County, GA (51%) which is a college county and where Athens, GA is located. In Massachusetts, she won 50% in Medford (Tufts) and 53% in Cambridge (Harvard). This connects back to Hillary’s win in Massachusetts. Sanders’ loss there is a bad sign for him. The state was made for him. It is in New England, it is heavily white, heavily working class, the Democrats are very liberal and it has a large number of colleges. 
At the same time though, Hillary did not deliver a knockout blow to Sanders that will cause him to drop out of the race this week. While she cemented her place as the front runner (by taking Massachusetts and winning both African Americans and Hispanics), Sanders will probably stay in the race much longer. He won CO showing he has a shot in the West and won MN showing he still has appeal to some liberals and working class voters. This could be a good sign for Sanders in other rural western states and the Upper Midwest in states such as Wisconsin (but not Michigan due to the African American population there). At the same time, Sanders needs to prove he can win a diverse state with high African American and Hispanic populations. Yesterday, he did not do that and every diverse southern state he lost by 29 to 59 points. Her margins among African American voters was unchanged from South Carolina. For example, she won 89% in Macon County and 90% in Greene County, AL. Both of these counties have extremely high African American populations, especially in the Democratic primary. 
So overall, this race will continue. Sanders is raising money, performing well in the caucus states but overall, it is still very likely that Hillary Clinton will be the nominee.
Final note: all county results can be found here:

Tuesday, February 23, 2016

Who won Nevada's Hispanic Vote?

After the Nevada caucus, Bernie and Hillary supporters are up in arms debating it. There is the debate over whether people were yelling  "English only" at Dolores Huerta. There is the debate over who has the most momentum but most importantly there is the debate over who won the Hispanic vote. The Sanders camp has long contended that they can win over voters of color and that Sanders is not simply a "candidate for white voters." 

The debate starts here: roughly 70% of Nevadans live in Clark County, the most urban and Democratic part of the state (Obama won 58% there in 2008 and 56% in 2012) and Clark County has the bulk of Nevada's Hispanics (30% of Clark County is Hispanic, 45% of Clark County is non Hispanic White). The other 30% of Nevada includes Washoe County with Reno and the rural counties are nicknamed the "Cow Counties." The U.S. Census quick facts website shows that the Hispanic population percentage is lower in these counties than Clark County. Sanders narrowly carried Washoe County and the "Cow Counties." Clinton however won Clark County by 10 points which was the entire winning margin for Nevada by 5-6 points. This would suggest that Clinton won the Hispanic vote but some Sanders supporters are saying that the entrance polls show Sanders leading with Hispanics which means he won Hispanics. Heavily Hispanic precincts voted for Clinton but Sanders supporters say Sanders won Hispanics in precincts with lower Hispanic populations. 

This article's goal is to not to prove that Hillary Clinton won Nevada's Hispanic voters but to show why exit/entrance poll crosstabs should not always be trusted, especially when judging the Hispanic vote.

We will examine this by looking at a few areas:
1. Clark County Voter Math
2. Why Exit Polls are not always reliable
3. Precincts with Medium Hispanic Populations

1. Clark County Voter Math

This point has been repeated thoroughly but in 22 heavily Hispanic majority  precincts, Hillary Clinton won the majority of the delegates. The Hillary campaign used these numbers to estimate that they won 61% of the Hispanic votes. She also overwhelmingly won the casino caucus sites which have high Hispanic populations. She did not win by narrow margins either, one precinct I had a friend awarded 28 delegates to Hillary and 12 to Sanders. This map below shows East Las Vegas which is heavily Hispanic.


Map of Las Vegas the red indicates white and green indicates Hispanic. As shown the large bulk of the Hispanic population is in East Las Vegas.


Map of East Las Vegas heavily Hispanic precincts and their primary results (map is from New York Times' writer Nate Cohn's Twitter)


African Americans were probably 14% of Clark County votes due to being 12% in the exit polls and the fact that outside of Clark County the African American population was low in Nevada. If the African Americans voted 76%-22% for Clinton (as shown by the exit polls) this means that Hillary Clinton won other voters by about three points. With heavily Hispanic East Las Vegas precincts voting for Clinton, it is safe to assume that the pockets of Sanders support came from areas with a higher White population.  

2. Why exit polls are not always reliable
Exit polls  have made mistakes with Hispanic votes previously. In 2004, they said Bush won 49% of Hispanic vote in Texas in 2004 and 56% in Florida in 2004. Results from heavily Cuban congressional districts and heavily Hispanic Osceola County seemed to confirm a result close to that, at least within a few points. When looking at Texas however, the heavily Hispanic counties suggest that Texas Hispanics voted more than 50% for Kerry.


(map courtesy of the New York Times of the Rio Grande Valley with the Democratic counties in 2004).

Take Webb County as an example in the Rio Grande Valley. The population of Webb County is 94% Hispanic which means it can show us how Texas Hispanics voted without other demographics changing the county results. Webb is also the most populated heavily Hispanic County in Texas above 90% Hispanic. Webb County voted 57% for Kerry. Other Rio Grande counties which were heavily Hispanic also backed Kerry, mostly by similar margins. One argument was that Bush performed better among Hispanics not in the Rio Grande Valley. The heavily Hispanic congressional districts outside of the Rio Grande Valley in San Antonio of TX-20 and TX-29 voted 55% and 56% respectively for Kerry according to the Almanac of American Politics 2006. Those numbers are lower than normal but still show that Hispanics voted more Democratic than 50%. 


3. Using precincts with medium Hispanic populations
I have heard the argument that Sanders performed better with Hispanics in precincts with 20%-40% Hispanics because he won some in Clark County. He also won a few in Washoe County as well which does not have as large or as dense Hispanic population. This brings me to California's 21st Congressional District located in Bakersfield and some rural agricultural communities in the southern Central Valley. The district voted 52%-45% for Obama in 2008 even though it was 70% Hispanic. This created the misconception that Hispanics in the Central Valley were more conservative. In 2013 and 2014, Democrats lost SD-16, a State Senate seat there and Republican touted this by saying that Hispanics could vote Republican. At a closer examination, the data showed that Hispanics mainly voted Democratic. I examined precincts such as Lost Hills, CA which were 96% Hispanic and showed that Hispanics voted heavily Democratic. At the same time, many precincts that were 90%+ White voted 80% for McCain.

Another example is Tulare County. It is 63% Hispanic but voted 41% for President Obama. It was not  however because Hispanics voted Republican but because Hispanic turnout was low in Tulare County. A few 90%+ Hispanic precincts were examined and while they backed Obama heavily (precincts in the southwest corner and in Orisi had 70%-80% margins for Obama), they had much lower turnout than surrounding whiter and conservative precincts. This shows that Hispanics in the Central Valley were not necessarily more conservative than Hispanics in Los Angeles. It shows that Hispanic turnout was low and the turnout from White voters was higher and most likely outnumbered Hispanics despite the higher Hispanic population. Reasons for the lower Hispanic turnout include that Hispanics are generally younger which means many are under 18 and many are not citizens and cannot vote. This is why it is important to use precincts to analyze Hispanics that are nearly 100% Hispanic because Hispanic turnout rates are generally lower than that of other demographic groups.

Precinct map of Tulare County's population (red is primarily white, green is primarily Hispanic, a district with both is a mix)


Map of Tulare County's votes in 2008: (courtesy of Dave's Redistricting App)


Some analyses have pointed to precincts with sizable but not majority Hispanic populations to show areas where Bernie performed well. However it is unclear whether that Bernie  support came from white voters or if it came from Hispanics. By looking at Tulare County though as an example, it appears that the White voters are overrepresented.

This explains my problem with justifying the Sanders win by looking at districts with medium sized Hispanic populations. As shown by Tulare County, Hispanics can be  underrepresented in precincts with lower Hispanic populations. That is why I want to only look at East Las Vegas precincts because the precincts have such a high Hispanic population so other demographic groups cannot dilute their votes. 

Conclusion: 
Overall, is Hillary or Bernie more popular with Hispanics? That question will only be fully answered when we see Texas vote on March 1st and see their exit polls. We can also examine the exit polls and see how closely they match Webb County and other heavily Hispanic counties in the Rio Grande Valley. So far, a YouGov poll shows Hillary with a 23 point lead among Texan Hispanics but as stated earlier, crosstabs are not always completely accurate. 


My educated guess though is that Hillary probably won Hispanics (although we do not know the margin) because poll crosstabs are known to be extremely inaccurate but actual precinct results from heavily Hispanic precincts which are not diluted are not. I will not however be 100% in any camp until Texas votes. 

Monday, January 25, 2016

Iowa Election Night Guide, Key Counties and County Benchmarks


After months of traversing the state, arguing about poll numbers and fighting for Iowan voters, the Iowa caucuses are in one week. The race started off with Clinton in a nearly insurmountable lead. Then in the summer, Bernie Sanders started to gain strength. By October, Sanders was nearly tied in Iowa but after the 1st debate and Hillary Clinton’s Benghazi smackdown, Clinton regained a lead. In January though, polls released after Christmas showed a narrow race and the polls have continued to show a close race. The RCP average as of Sunday January 24th show Clinton with a seven point lead but as history shows, the polls can shift within a week and some observers believe the polls are skewed.


This post will show what counties to watch in Iowa on Election night. The post will have an explanation of the three regions of Iowa and show county benchmarks for counties Sanders and Clinton need to win in order to win the caucus.


Notes:
  1. It should be noted that unless one is privey to the Clinton or Sanders data, it will be nearly impossible to make an accurate prediction as to who will win which counties. I calculated it by giving Sanders all of the Obama 2008 voters, giving Hillary all of the Hillary 2008 voters and splitting the Edwards voters between them until Hillary received 50%. These benchmarks assume Sanders will keep the Obama voters (younger, urban and college educated) and Hillary will keep her voters.


2.  I would like the comments on the diary to be as civil as possible, yes from both sides.


3. Polls show the Iowa caucuses are hard to predict. Some polls predict massive voting turnout and a Sanders win (CNN Sanders +9) and other polls predict smaller turnout (around the low 100s) and a Clinton win (KBUR Clinton +9). The number Sanders needs to win of new voters is between 25%-30%, higher and he wins, lower and he loses.


4. It should be noted that the way caucuses work for Democrats is that they are voting for precinct representatives who are already allocated proportionally so if turnout is concentrated (for example in college towns which should support Sanders), it  may be difficult for Sanders to win especially with Hillary’s support more spread across the more moderate rural areas. Also, the percentages may be changed if actual votes are not reported but instead delegates are.


5. Martin O’Malley is not included and it should be noted the percentages listed are only for Hillary and Sanders.


County Benchmarks:
Dark Yellow: Hillary 55%+
Light Yellow: Hillary 50%-54%
Light Green: Sanders 50%-54%
Dark Green: Sanders 55%+

Google doc with full county percentages:


Eastern Iowa
A few counties here went narrowly for Clinton but eastern Iowa is where Sanders must run up numbers in order to win. There are large numbers of Progressives and college towns here. There are rural voters too but this is a less rural part of Iowa. Here are a few key counties:


Johnson County is Sanders’ best county and he needs it to be. Johnson County is home to the University of Iowa (which Carly Fiorina famously supported in hopes it would win her votes but instead won her the title of a flip flopper and slayed her polling numbers). Iowa polls on average show a mid single digit Clinton lead but a few such as CNN/ORC show a Sanders lead. Those polls show a Sanders lead because they predict an Iowa caucus turnout higher than in 2008. In order for Sanders to win the Iowa caucus, he needs to run up the score in college counties such as Johnson. Sanders can attract crowds but he needs them to turnout, especially in the snow which is predicted for Monday.


Linn County (Cedar Rapids) is the 2nd largest city in Iowa and has a Progressive history as well requiring Sanders to perform well there.


Winneshiek County may not be as populated as the other two but it is important because Sanders had a rally with 2,000 people there in a town of 8,000 a week before the caucus. While those attendees may be from different towns as well and some may be swing voters, it could indicate that Sanders support is strong here.


Eastern Iowa is also more populated than the other two regions which is why this map is 50-50, even most counties supporting Clinton because the Sanders counties are urban counties.


Counties to watch:
Johnson: Sanders 62.2%
Linn: Sanders 53.4%
Winneshiek: Sanders 56.7%


Central Iowa:
It appears the election can be won or lost in Central Iowa. It is a mixture of both urban and rural areas with Des Moines, the capital of Iowa mixed in with Story County, another college town and many rural counties predicted to strongly support Hillary which are mainly sparsely populated. Here are the key counties:


Polk County:
Des Moines, the Iowan Capital is here and 16% of the state’s Democratic votes were cast here, cementing its status as a strong factor in the Iowa caucuses. Historically, Polk County casts more votes than a large number of the Clinton heavy counties on Iowa’s southern border combined. While many of the White Progressives in Polk are expected to support Sanders, Clinton may be able to narrow the margin (but not enough to win Polk in a 50-50 race) by winning large margins among the voters of color (Polk County has a 21% voters of color population which is larger than other Iowan counties). Sanders needs four or more points here to win.


Story County:
Story County is another college town and Iowa state is located here. It is also the location of the famous Iowa straw poll. Sanders also needs heavy turnout here in order to win.


Wayne County:
While Wayne County is not a densely populated county such as Polk County (2,900 votes were cast in 2012 there, compared to 228,000 for Polk), it is a barometer for Hillary Clinton and how well she is performing with rural voters.


Polk County: Sanders 51.7%
Story County: Sanders 54.6%
Wayne County: Clinton 64.3%

Western Iowa
Western Iowa is much different from eastern Iowa. It is less populated and has more Republicans, meaning there are less potential caucus goers here. It is also home of Rep. Steve King (R) who  make immigration comments that would make Donald Trump appear xenophobic. At the same time, a large number of western Iowans do not  share these views and 45% in 2012 backed his opponent. There are few college towns here so this is where Hillary will need a strong showing. Almost all counties are shown as Hillary counties but President Obama won in Sioux County which is the most conservative county in Iowa by winning over disaffected Republicans. Should Bernie have a great night he could surprise observers by winning either Sioux or Plymouth Counties.


Sioux County:
Romney won 83% of the vote here in 2012, making it the most Republican county in Iowa. President Obama won it by winning over disaffected Independents and Republicans, it remains to be seen if Sanders can exert the same pull here.


Pottawattamie County:
One of Western Iowa’s larger cities, Council Bluffs is located here. This is part of Hillary’s base if the benchmarks prove correct and she will need a strong margin from here. The problem for her though is that there are less Democratic voters here than in similarly populated counties in eastern Iowa.


Dickinson County:
Dickinson County is one of the few western Iowa counties where Sanders is leading with the benchmarks. It also voted 50.9% for Sanders so Dickinson could be viewed as a bellwether.


Sioux County: Clinton 51.3%
Pottawattamie County: Clinton 59.6%
Dickinson County: Sanders 50.9%


Overall, while watching election night, keep a few points in mind.
1. Is Bernie Sanders turning out voters in the urban and college counties such as Polk, Johnson and Linn?
2. Is Hillary Clinton turning out the vote in rural counties in western Iowa, making inroads in rural eastern Iowa counties and are the voters of color in Polk County making Polk a close county?

3. Most importantly, are these benchmarks consistently holding muster? Do not watch just one county early in the night and predict a Clinton or Sanders win if one candidate overperforms in one or two counties.